

By Ben Copeland (Linaro)
KernelCI builds, boots and tests the Linux kernel across dozens of trees and well over a hundred hardware platforms, around the clock. That produces a lot of data: a single mainline checkout can carry sixty-odd builds, nearly two hundred boots and tens of thousands of test results. The web dashboard is the place to browse it, and kci-dev is the command-line tool for people who would rather script it. As of the 0.1.x releases, kci-dev can also hand that data straight to an AI assistant through the Model Context Protocol (MCP).
Why hand it to an assistant? Because triage is mostly joins. Almost every question a triage engineer asks is a join between two or more views of the data: this failure against the known issues list; this commit against the ones before it; this platform against the same platform on other trees. The dashboard shows one view at a time. An assistant with the right tools can make the joins for you and show only the intersection.
This post explains what the new kci-dev mcp command does, how to configure it in minutes, along with the automated triage workflows it currently powers. It also explains the foundation the MCP server builds on: the public Python API added by kci-dev creator and leader Arisu Tachibana.
First, the foundation: kci-dev as a Python library
For most of its life, kci-dev was exposed primarily as a Click-based CLI. Much of its implementation was reusable internally through kcidev.libs.*, but there was no stable public Python API for external applications. Integrations therefore had to either depend on internal helpers or shell out to the CLI.
That changed with pull request #277, “Make possible to use kci-dev as a Python library”, contributed by Arisu Tachibana (Cybertrust Japan Co., Ltd.), which made kci-dev available as a Python library. This gave the MCP server a clean way to use KernelCI directly, instead of calling and parsing CLI commands.
PR #277 is one contribution within a much longer story. kci-dev was created by Arisu in 2024, and she has led its development ever since, from the first commit through to the current release, shaping its direction and building it into the tool this post describes. The Python library is one step in that work, not the extent of it.
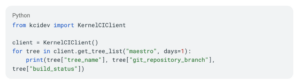
Arisu also added run_command() for integrations that need CLI-compatible behaviour without spawning a subprocess. More importantly for MCP, KernelCIClient exposed KernelCI operations through a public Python API, which the MCP server now uses directly. Thank you, Arisu.
What MCP is, in one paragraph
The Model Context Protocol is an open standard for connecting AI assistants to external tools and data. An MCP server describes a set of tools (a name, a description, and typed parameters); an MCP client such as Claude Code, Claude Desktop, Cursor or any other compatible agent reads that description and lets the model call the tools when it decides they are relevant. The server handles authentication to KernelCI. The assistant receives tool inputs and outputs, which may include logs and patch contents. The dashboard data is public and reading it needs no token at all; a token only comes into play if you configure the job-submitting tools. For KernelCI this means an assistant can ask the dashboard the same questions you would, but faster, in bulk, and while keeping the thread of a conversation.
Setting it up
MCP support is an optional extra, so it does not add dependencies for people who only want the CLI:

The read-only dashboard tools work immediately, without configuration and without any token. Then register the server with your client. For Claude Code, it’s a single command:

The same shape works for OpenAI’s Codex CLI, with codex in place of claude:

and any other client that supports the stdio transport can launch kci-dev mcp the same way. If you want to point several tools at one process, or run it inside a container, there is also a streamable HTTP transport:

One caution here: the HTTP transport has no authentication layer of its own. Anyone who can reach the port can call every exposed tool, including the job-triggering ones if you have configured a token. Keep it bound to localhost and prefer stdio for day-to-day use.
To unlock the Maestro tools (Maestro is KernelCI’s pipeline API), add an instance to ~/.config/kci-dev/kci-dev.toml with an api URL (for node lookup) and a pipeline URL plus token (for retries and custom checkouts), then select it with kci-dev –instance <name> mcp. The configuration file documentation covers the details, and tokens can be requested through the usual kernelci-core issue template.
A hosted instance
If you would rather not install anything, we run a hosted endpoint at https://mcp.kernelci.org/mcp over streamable HTTP. Register it with Claude Code:

or with Codex: codex mcp add kernelci –url https://mcp.kernelci.org/mcp. It serves the read-only query tools; the job-triggering tools stay local, on a server configured with your own token as described above.
What the assistant can see and do
Grouped by what you use them for, rather than as a reference list. The first two groups are read-only dashboard tools and always available; the acting group appears when the selected instance is configured for Maestro.
Get the picture:
- list_trees: trees with recent results, including git URL, branch and latest commit. This is the entry point; everything else needs a tree, branch and commit.
- get_summary: build, boot and test status counts for one commit, with per-architecture and per-compiler breakdowns and the known issues matched against it.
- list_hardware, get_hardware_summary: results by platform over the last seven days.
Investigate failures and regressions:
- list_commits: the checkout history of a branch with result counts per commit, which is how you spot where a regression appeared.
- list_builds, list_boots, list_tests: paginated lists with arch, tree, date range and status filters and a fields projection to keep responses small.
- get_build, get_test: full details for a single build, boot or test, including logs.
- list_issues, get_issue, get_issue_builds, get_issue_tests: KernelCI’s recognised failure patterns and everything they are matched against.
Act on the results (Maestro):
- retry_job: re-run a failed or incomplete job.
- trigger_checkout: start a custom pipeline run for a git URL, branch and commit, restricted to named jobs and platforms.
- trigger_patchset: apply patches on top of an existing checkout and run the pipeline on the result.
- get_node, list_nodes: poll the jobs you started, with field=value and regex filters.
State-changing tools are annotated as non-read-only. Whether they require confirmation depends on the MCP client and its approval settings.
Responses are deliberately sized for context-limited clients. get_summary returns compact aggregates unless detail=true is passed, list tools paginate with a default limit of 20, and fields let the model ask for only the keys it needs. This matters more than it sounds: a full test list for one mainline commit can run to tens of thousands of entries, and an assistant that pulls all of that into its context window will not be an assistant for long.
Workflows it is good at
The morning look
The most common triage question is “what is red today, and is any of it new?”. Answering it by hand means opening the dashboard, picking a tree, scanning the summary, clicking into the failures, and checking each one against the known issues list. With the MCP server the conversation looks like this:
You: What is the state of mainline master right now? Only tell me about failures that are not already known issues.
The assistant calls list_trees to find the latest mainline commit, then get_summary for it. Running that against a real checkout this week returned 63 passing builds and 3 failing, 189 boots all passing, and 33,047 passing tests against 4,781 failures. The summary also carried the three build failures already matched to known issues: an amdgpu stack frame size overflow, a -Wformat error in qla2xxx, and an inline assembly register exhaustion in nf_synproxy_core on i386. So the honest answer to the question is “all three reported build failures match known issues; no unmatched build failures were found in this checkout”, and the model can say so in one line, then move on to list_tests with status=fail to look at what is actually new in the test results.
Those numbers are not invented for the post; they were recorded for the referenced checkout on 26 August 2026, and current results may differ. Trimmed, the shape the model sees is:

Chasing a regression back to a commit
You: The arm64 boots on next/master started failing sometime this week. Which commit introduced it?
list_commits returns the branch history with build, boot and test counts per checkout, so the assistant can see the point at which the boot failure count stopped being zero, then call list_boots with arch=arm64 and status=fail on either side of it to confirm the platforms involved. From there it is a short step to kci-dev bisect on the range, and the assistant can hand you the exact command with the good and bad hashes filled in.
Is this failure mine, or everyone’s?
You: Is the atmel-mci build failure a stable-rc specific problem or does it show up elsewhere too?
list_issues returns this week’s recognised failure patterns, get_issue gives the details of one, and get_issue_builds lists every build it has matched, across every tree. Asking that question this week showed the atmel-mci “no member named bh_work” error appearing on four stable-rc branches (5.10, 5.15, 6.1 and 6.6) within the same hour on 20 August, and on no other tree, which is the signature of a backport rather than a new upstream bug. A multi-step manual check becomes a single question, and the assistant can lay out the affected branches in a table.
Hardware health
You: Which platforms have had boot failures on mainline in the last week?
list_hardware followed by get_hardware_summary for the candidates gives a per-platform picture. This is the question lab maintainers ask most, and it is the one the dashboard makes hardest to answer across many boards at once.
Retest, and test a fix
With a token configured, the same conversation can carry on into action:
You: That looks like a flaky boot on the rk3399 rock-pi-4. Retry it, and let me know when it finishes.
retry_job creates the new job; get_node polls it. And if you have a candidate fix:
You: Apply this patch on top of the latest mainline checkout and run only baseline-arm64 on the Raspberry Pi 4 and the rock-pi-4.
trigger_patchset does exactly that, returning a node id you can watch with list_nodes filtered by treeid. Because these tools are marked as actions, the client will show you the parameters and ask before it sends anything.
Patch testing is new in kci-dev and works the same way from the CLI. It is a two-step flow: kci-dev checkout creates a checkout of the tree, branch and commit your patches are based on and prints a checkout_nodeid; kci-dev patchset –nodeid <id> then applies patches on top of it and runs the pipeline on the result. Patches can be local files from git format-patch or URLs from an allowed domain such as patchwork.kernel.org, which means you can test a series straight from the list before it is applied anywhere:
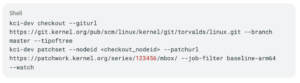
The MCP trigger_patchset tool takes the same nodeid, patches or patchurls, job_filter and platform_filter, so an assistant that has just found a failure can be asked to test the proposed fix without you leaving the conversation.
Reproduce it locally
You: The i386 allmodconfig build with clang failed. Give me what I need to reproduce it on my machine.
Where reproduction artifacts are available, the assistant can retrieve the build script, configuration, and metadata to help recreate the recorded build environment. get_build returns them in output_files: the exact build.sh the job ran, the final .config, the config fragments, a metadata.json with the architecture, compiler, defconfig and fragment list, and the source tarball URL. The assistant can fetch build.sh and hand you the environment (ARCH, CC, LLVM=1) and the make steps in order.
For the kbuild jobs that use the tuxmake backend, our kernel building tool, maintained by Linaro, it collapses further. tuxmake is the build tool used by KernelCI’s pipeline for its kselftest and several other configurations, and it is designed for portable, reproducible kernel builds inside containers. The build.sh for one of this week’s mainline arm64 builds contains this:
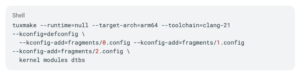
and the job also publishes a tuxmake_metadata.json with a reproducer_cmdline field and the exact toolchain version (clang 21.1.8, tuxmake 1.38.0 in this case). Newer builds go one better and publish a ready-made reproducer.sh that pins the toolchain container image and the build environment. Swap –runtime=null for –runtime=podman or –runtime=docker, point it at your checkout of the same commit, and tuxmake pulls the matching toolchain container and runs the identical build on your laptop. An assistant can do that translation for you, fragments and all.
Why this is a good fit for triage work
It would be easy to read the above as “the chatbot can click buttons for you”. The value is more specific than that: these are the tools that let an assistant make the joins the intro talked about, and a few more things besides.
It keeps the thread. A conversation remembers which tree, branch and commit you are looking at. You can drill from summary to failed builds to a single build’s log and back up again without re-entering anything, and the assistant can summarise a 2,000-line build log to the two lines that matter.
It can draft the report. The end product of triage is usually a message to a mailing list or a bug tracker: which trees, which platforms, which commit range, links to the evidence. The assistant already has all of that in its context by the time you ask, and it produces the write-up in the format you ask for.
It is the same data. The MCP server calls the same dashboard endpoints and the same Maestro API that the CLI and the web UI use, through Arisu’s KernelCIClient. There is no separate cache, no summarised copy, nothing that can drift out of date. If the assistant says a build failed, you can paste the build id into the dashboard and see the same thing.
It composes with what you already have. Because the server runs locally alongside your other tools, the assistant can combine KernelCI data with your git checkout, your mail client, or your issue tracker in one session. “Find the failing test, read the log, look at the diff of the suspect commit in my tree, and draft a reply to the author” is one prompt, not four tools.
Experimental, and asking for your help
The MCP server is marked experimental. Tool names, parameters and response shapes may change between releases as we learn how people actually use them, and we would rather hear about rough edges now than lock in a poor design. Please report anything surprising on the kci-dev issue tracker, and if you have a workflow the tools do not cover yet, say so; several of the filters and the fields projection exist because early users asked for them.
Where this is heading
Three directions are worth flagging, from already usable to still a proposal.
Closer to the lab. Most KernelCI boards run under LAVA, the lab automation framework maintained by Linaro, and Linaro also operates lab capacity feeding KernelCI. Today the MCP server already gets you part of the way in: a test or boot node carries the URL of its LAVA log, so an assistant can pull the raw job output and read the kernel panic, the failed test case, or the board that never answered its serial console. The natural next step is LAVA-aware tools in the server itself (job status, device health, resubmission), so that one conversation can go from a red cell on the dashboard, to the lab job that produced it, to the log line that explains it, without switching windows.
Reviews with test data in reach. Having the MCP available provides agent-driven code reviews and debug sessions with access to the test data from KernelCI, enabling them to do things like cross-reference reported issues with test results even with minimal prompting. With some work in projects like review-prompts we expect to improve the effectiveness of this integration.
Triage that starts on its own. Everything in this post is pull: a person with an assistant asks questions. An open RFC on kernelci-pipeline, #1565 by Yogesh Lal, explores the push side. It adds a TriageNotifier to the LAVA callback; when a job comes back failed or incomplete, the pipeline hands it to a separate triage-agent service that reads the LAVA log, runs a kernel triage skill through an LLM, and writes a Markdown root-cause report that can be filed as a GitHub issue or emailed. It is off by default and still under discussion, but it is the same idea seen from the other end: the MCP server gives a human an assistant, the triage-agent gives the pipeline one. If both land, the report waiting in your inbox and the conversation you have about it will be drawing on the same data.
Getting started
- Install: pip install ‘kci-dev[mcp]’
- Documentation: kci.dev/mcp and the config file reference
- Source: github.com/kernelci/kci-dev
- Questions and feedback: the public mailing list at kernelci@lists.linux.dev, the KernelCI Discord, or #kernelci on libera.chat
Install it, try it on your next triage, and join the conversation on the KernelCI Discord to share your experience with MCP workflows.
Acknowledgements
Thanks to Arisu Tachibana (Cybertrust Japan Co., Ltd.), Mark Brown (Arm), Yogesh Lal (Qualcomm) and Denys Fedoryshchenko (Collabora) for their reviews and corrections to this article.
Bio
Ben Copeland chairs the KernelCI Technical Steering Committee and is a Senior Automation CI/CD Engineer at Linaro, where he leads the KernelCI team working to ensure the long-term stability of the Linux kernel.