

The KernelCI project is a critical initiative in the Linux kernel development ecosystem, providing automated testing and continuous integration for kernel builds. In this blog post, we’ll explore the current features available in the KernelCI Dashboard at https://dashboard.kernelci.org.
KernelCI Dashboard Overview
The current KernelCI Dashboard provides a comprehensive view of kernel testing activities, organizing information into three primary sections: Trees, Hardware, and Issues. This structure allows developers to easily navigate between different aspects of kernel testing. In this web dashboard, it’s possible to see the results of CI systems from different maintainers, checking their status, details, history and issues, while gathering valuable insight to work on a better and more reliable kernel.
Trees
The Trees section serves as the main entry point to the dashboard, displaying a tabular view of kernel trees, branches, and commits being tested. The Dashboard visitor is then able to select the one they are interested in – a tree is a fork of the linux kernel with a specific branch and targeting a specific url.
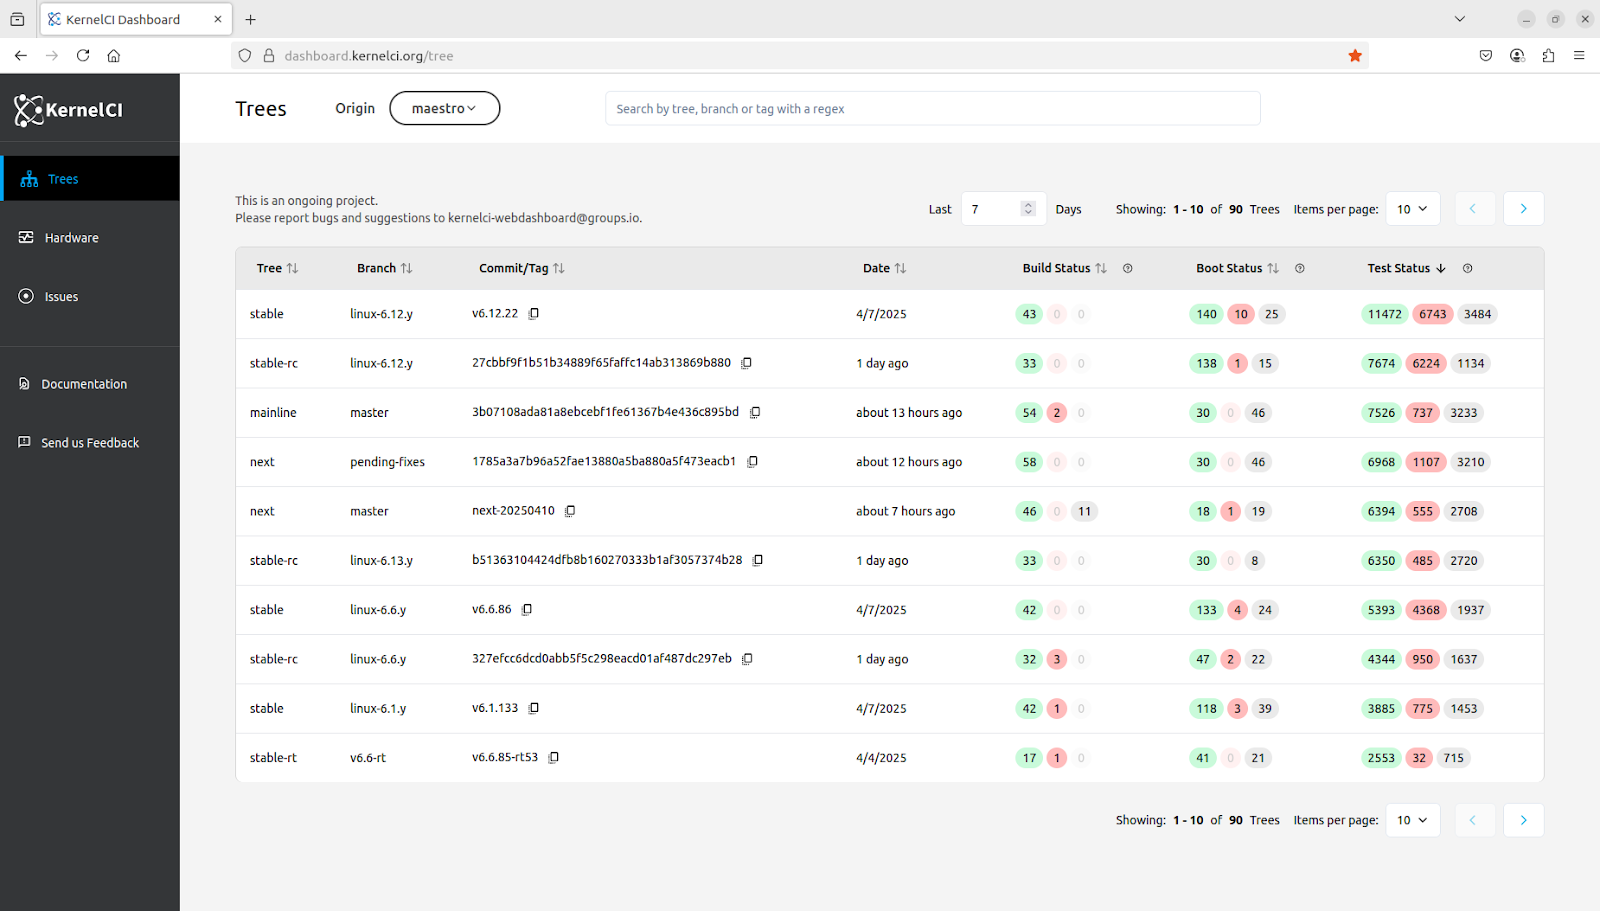
> Image: The Tree Listing page. It shows the website menu on the left, a header on top with a search bar and a table listing the 10 trees with the most number of tests, each row has the tree information as well as counts for how many builds, boots and tests were executed on it.
With options for sorting and searching for a specific tree, it is possible to check the details of a desired tree, where a user can see which configurations, architectures, hardware, and a history of the builds, boots and tests.
This allows maintainers to see the successes, failures and other results of the CI systems and are able to focus their attention on what matters the most to them. A preview of a build or test can be seen right on this page, reviewing tests or builds outputs, with highlights to failures and errors, and a list of issues that were triggered from it.
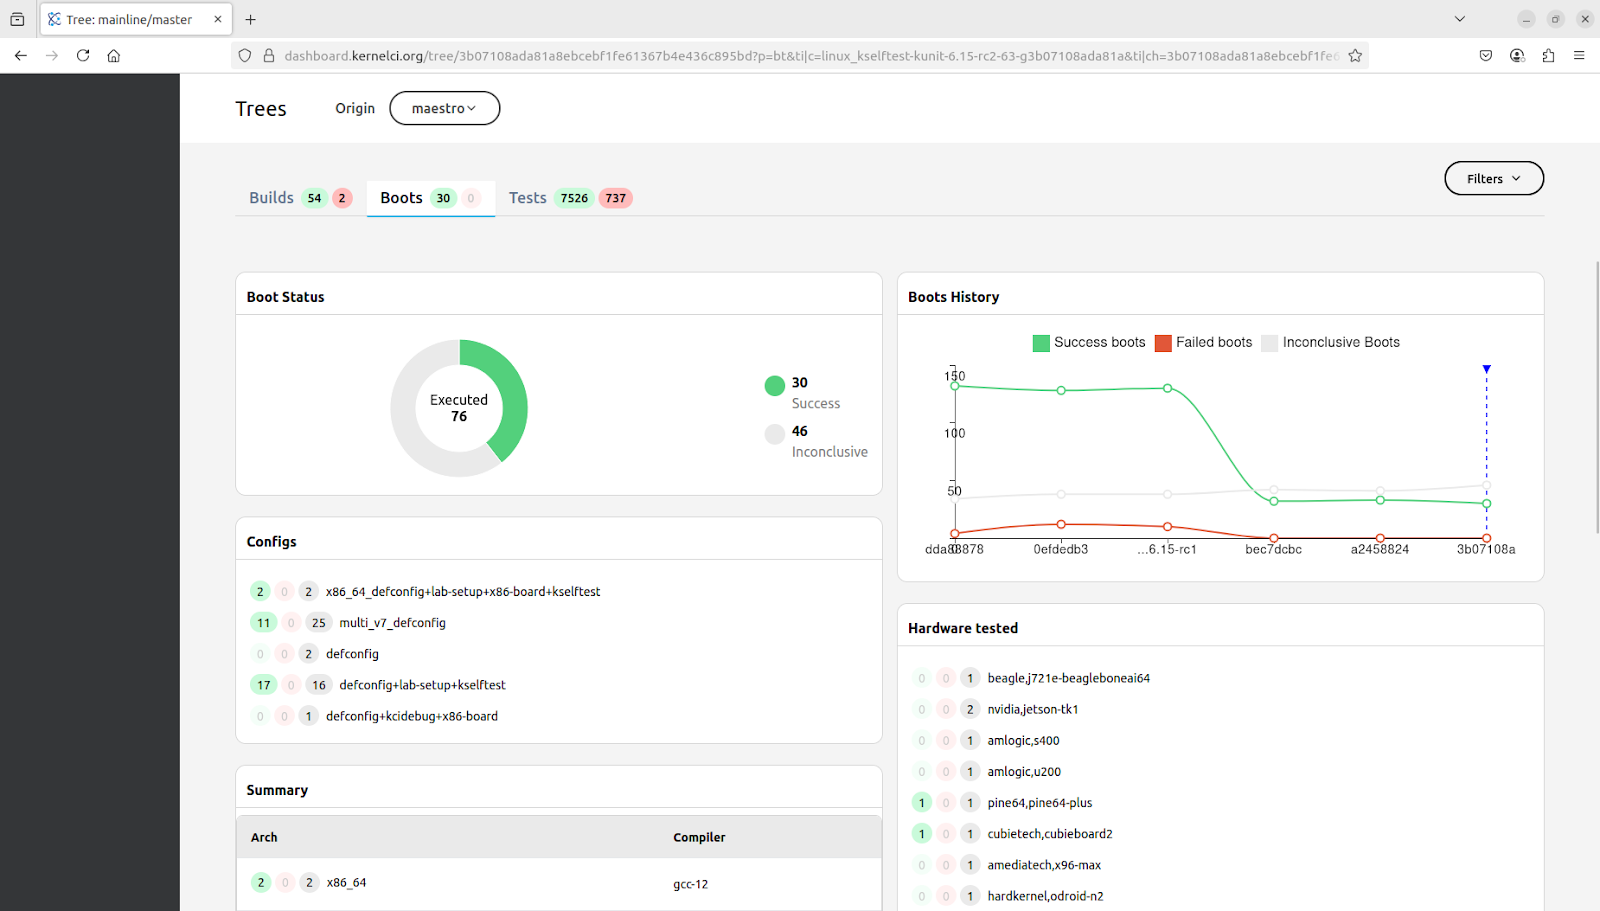
> Video: Navigating to the mainline Tree Details. There are cards with information about the specifications used, graphs for the result status and history of results, and a list of boot tests. A boot is selected and its output and issues are shown.
Builds and Tests
Each build and test also has a lot of data that a maintainer can find useful, so by pressing “View more details”, the user is directed to a page containing more information about that specific item, such as a the platform that was tested on, a history of a test result, the artifacts (logs or result files) that a test or build produced, and miscellaneous data. For a build, it is also possible to see every test that was executed on it, with links to the details of those tests.
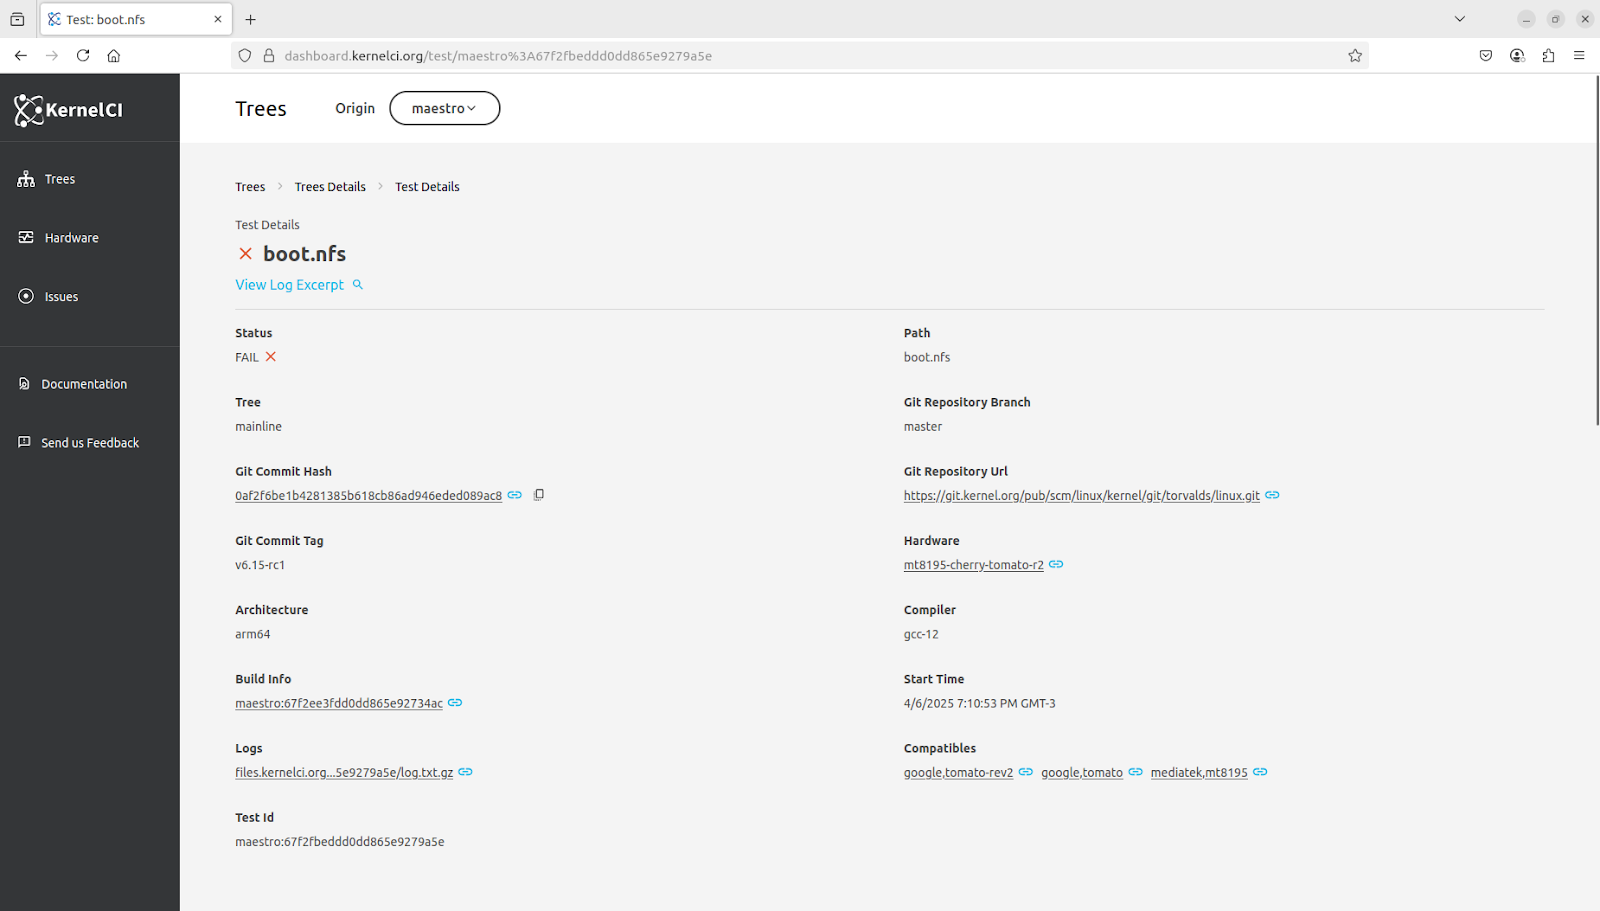
> Video: A boot test details page. There are sections with basic information, as well as the history of its results, miscellaneous data from it, and the files it produced as artifacts.
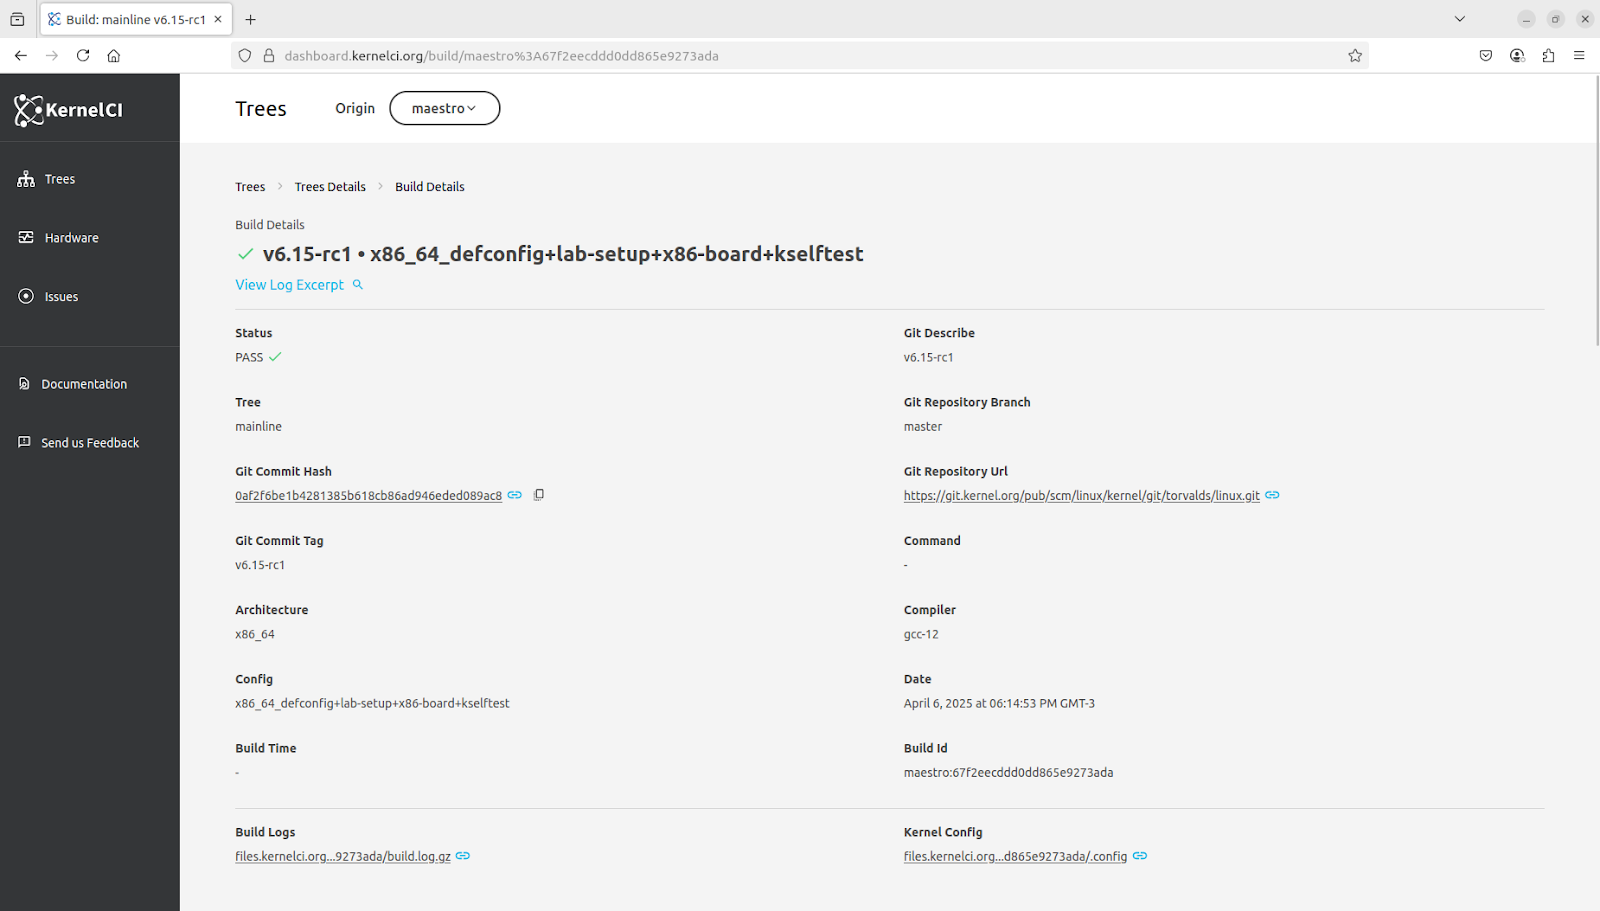
> Video: A page with details of a build. There are sections with basic information, miscellaneous data, output files, and a table listing the tests that were performed on it.
Hardware
The Hardware section focuses on the physical devices used for testing, providing insights into how different kernels perform across various hardware platforms. Maintainers of such items might want to see the results of tests for that hardware independently of which tree it came from. For that purpose, the dashboard also contains a tab for listing the hardware that were tested on.
The listing is similar to that of trees, but when entering the details pages, it is possible to see all the trees that contributed to testing on that hardware, as well as disabling or enabling the visualization of the results from that tree.
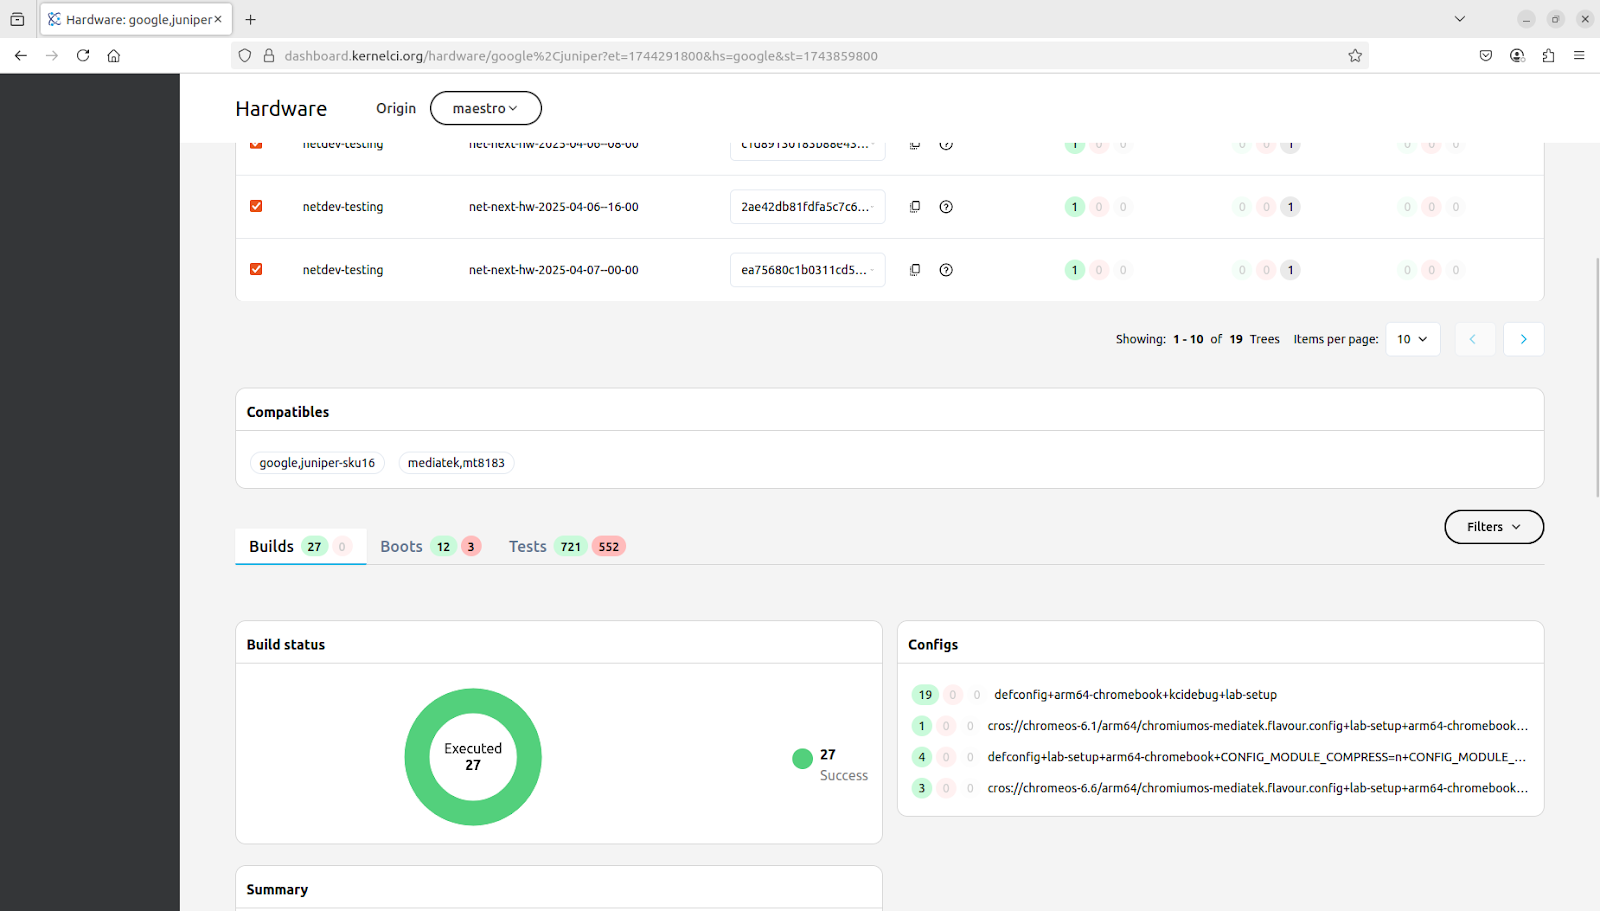
> Video: Navigation from the hardware listing page to a hardware details page. The details page shows a table at the top listing the trees that tested or had builds on that hardware, with their corresponding commit and counting of total builds, boots and tests.
Not only for trees in a specific hardware or hardware on a specific tree, it is also possible to filter for any of the card items by clicking on them or using the Filters button, allowing for better visibility of items that a user may be interested in.
Issues
The Issues section is dedicated to tracking problems identified during testing, making it easier for developers to identify and address failures.
Issues group tests or builds when their results had a certain status or had a certain message in their logs or other conditions. In the dashboard, it is possible to list the most recent issues and when and where they have appeared, resembling the other listing pages.
From that page or from links throughout the dashboard, a user can navigate to a page with details of that issue, including the first time that issue caught a result, the specific data of how that issue came to be, and a list of every incident of that issue, builds or tests.
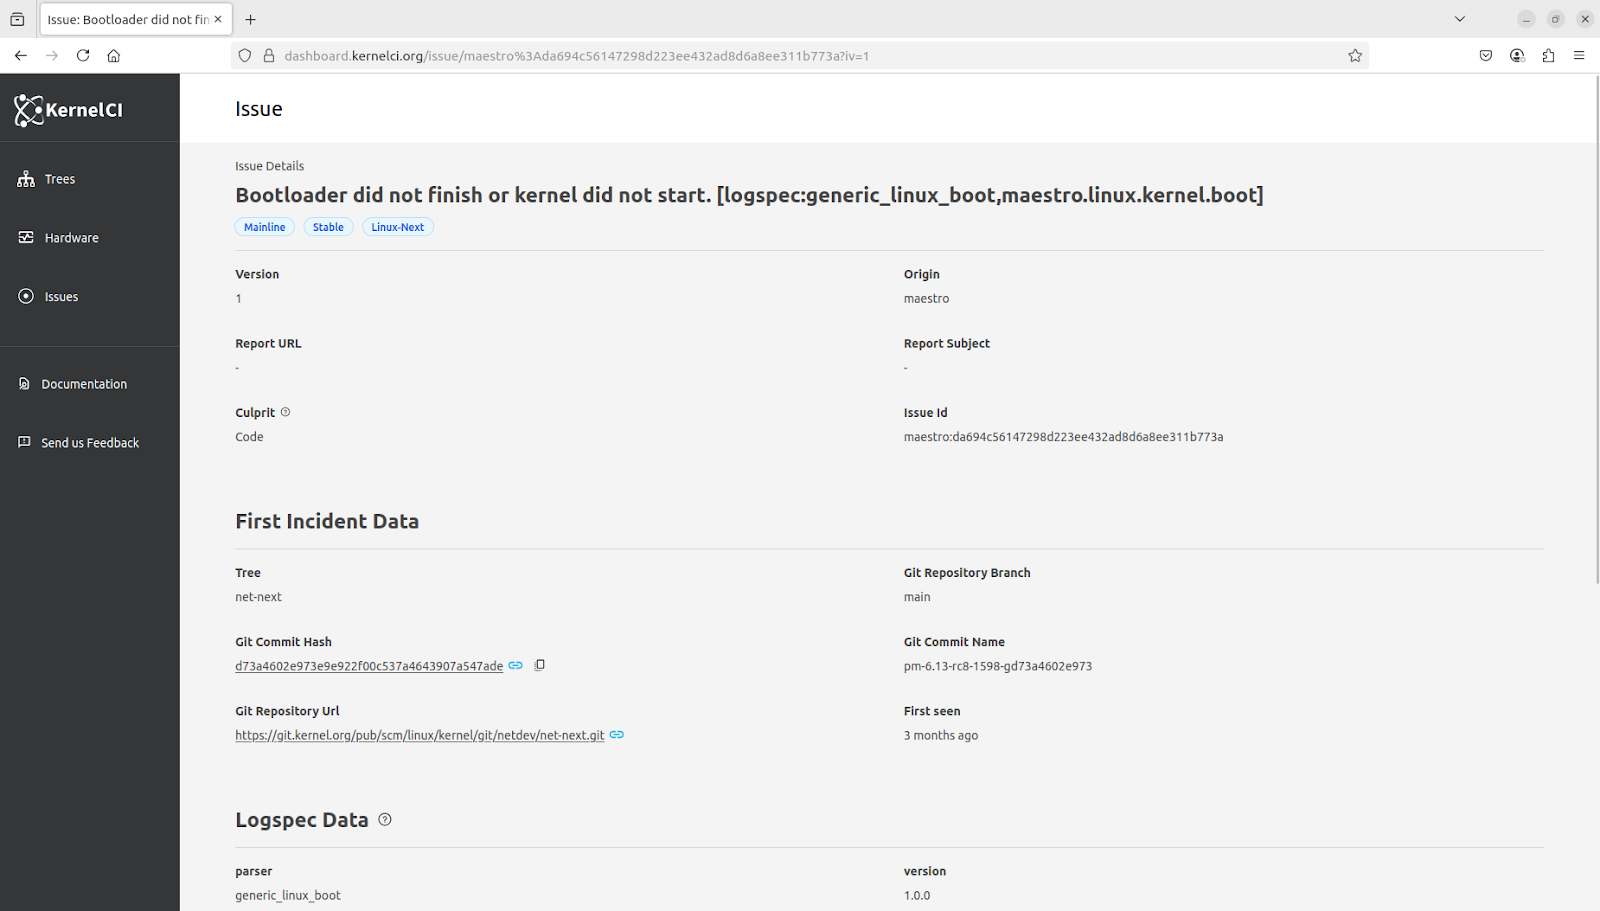
> Video: Navigating from the issue listing to an issue details page. The detailed page shows sections of the issue’s information, its first incident, the specifications of its error, miscellaneous data, and a table with builds that triggered that issue.
Closing thoughts
The current KernelCI Dashboard provides a powerful interface for monitoring, analyzing, and troubleshooting kernel testing results. Its comprehensive features make it an essential tool for kernel developers, distributions, and hardware vendors who rely on Linux kernel stability and compatibility.
The dashboard allows users to inspect CI results from trees, hardware, builds, and tests; checking for specific issues, filtering for certain configurations and looking over results of their interest. Coupled with detailed pages, interactions and CI results history, it provides better tools for specific use cases, enhanced visualization, and improved troubleshooting capabilities. With a redesigned interface and easy shareability and filtering, the Dashboard can address the needs of different users in the kernel development ecosystem, from maintainers to lab operators.
Whether you’re a kernel developer tracking your patches, a distribution maintainer ensuring stability, or a hardware vendor verifying compatibility, the KernelCI Dashboard (both current and future versions) offers the insights and tools needed to ensure Linux kernel quality across the ecosystem.
Users are encouraged to report bugs and suggestions to kernelci-webdashboard@groups.io to help improve this vital project.
We’d like to thank you ProFUSION for their contributions to this project as supplier of the KernelCI Project. This blog post was written by then.