THE LINUX FOUNDATION PROJECTS
Category

Blog

Talk to KernelCI: kci-dev now speaks MCP

By Blog

By Ben Copeland (Linaro)

KernelCI builds, boots and tests the Linux kernel across dozens of trees and well over a hundred hardware platforms, around the clock. That produces a lot of data: a single mainline checkout can carry sixty-odd builds, nearly two hundred boots and tens of thousands of test results. The web dashboard is the place to browse it, and kci-dev is the command-line tool for people who would rather script it. As of the 0.1.x releases, kci-dev can also hand that data straight to an AI assistant through the Model Context Protocol (MCP).

Why hand it to an assistant? Because triage is mostly joins. Almost every question a triage engineer asks is a join between two or more views of the data: this failure against the known issues list; this commit against the ones before it; this platform against the same platform on other trees. The dashboard shows one view at a time. An assistant with the right tools can make the joins for you and show only the intersection.

This post explains what the new kci-dev mcp command does, how to configure it in minutes, along with the automated triage workflows it currently powers. It also explains the foundation the MCP server builds on: the public Python API added by kci-dev creator and leader Arisu Tachibana.

First, the foundation: kci-dev as a Python library

For most of its life, kci-dev was exposed primarily as a Click-based CLI. Much of its implementation was reusable internally through kcidev.libs.*, but there was no stable public Python API for external applications. Integrations therefore had to either depend on internal helpers or shell out to the CLI.

That changed with pull request #277, “Make possible to use kci-dev as a Python library”, contributed by Arisu Tachibana (Cybertrust Japan Co., Ltd.), which made kci-dev available as a Python library. This gave the MCP server a clean way to use KernelCI directly, instead of calling and parsing CLI commands.

PR #277 is one contribution within a much longer story. kci-dev began in 2024 as Arisu’s own initiative: she proposed and built it at a time when the value of a simpler developer-facing interface to KernelCI was not obvious to everyone, kept developing it, and the tool later became an official KernelCI project. She has led its development ever since, from the first commit through to the current release. The public Python API, and now the MCP server built on it, continue that original direction.
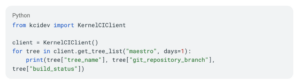
Arisu also added run_command() for integrations that need CLI-compatible behaviour without spawning a subprocess. More importantly for MCP, KernelCIClient exposed KernelCI operations through a public Python API, which the MCP server now uses directly. Thank you, Arisu.

What MCP is, in one paragraph

The Model Context Protocol is an open standard for connecting AI assistants to external tools and data. An MCP server describes a set of tools (a name, a description, and typed parameters); an MCP client such as Claude Code, Claude Desktop, Cursor or any other compatible agent reads that description and lets the model call the tools when it decides they are relevant. The server handles authentication to KernelCI. The assistant receives tool inputs and outputs, which may include logs and patch contents. The dashboard data is public and reading it needs no token at all; a token only comes into play if you configure the job-submitting tools. For KernelCI this means an assistant can ask the dashboard the same questions you would, but faster, in bulk, and while keeping the thread of a conversation.

Setting it up

MCP support is an optional extra, so it does not add dependencies for people who only want the CLI:

The read-only dashboard tools work immediately, without configuration and without any token. Then register the server with your client. For Claude Code, it’s a single command:

The same shape works for OpenAI’s Codex CLI, with codex in place of claude:

and any other client that supports the stdio transport can launch kci-dev mcp the same way. If you want to point several tools at one process, or run it inside a container, there is also a streamable HTTP transport:

One caution here: the HTTP transport has no authentication layer of its own. Anyone who can reach the port can call every exposed tool, including the job-triggering ones if you have configured a token. Keep it bound to localhost and prefer stdio for day-to-day use.

To unlock the Maestro tools (Maestro is KernelCI’s pipeline API), add an instance to ~/.config/kci-dev/kci-dev.toml with an api URL (for node lookup) and a pipeline URL plus token (for retries and custom checkouts), then select it with kci-dev –instance <name> mcp. The configuration file documentation covers the details, and tokens can be requested through the usual kernelci-core issue template.

A hosted instance

If you would rather not install anything, we run a hosted endpoint at https://mcp.kernelci.org/mcp over streamable HTTP. Register it with Claude Code:

or with Codex:


It serves the read-only query tools; the job-triggering tools stay local, on a server configured with your own token as described above.

What the assistant can see and do

Grouped by what you use them for, rather than as a reference list. The first two groups are read-only dashboard tools and always available; the acting group appears when the selected instance is configured for Maestro.

Get the picture:

  • list_trees: trees with recent results, including git URL, branch and latest commit. This is the entry point; everything else needs a tree, branch and commit.
  • get_summary: build, boot and test status counts for one commit, with per-architecture and per-compiler breakdowns and the known issues matched against it.
  • list_hardware, get_hardware_summary: results by platform over the last seven days.

Investigate failures and regressions:

  • list_commits: the checkout history of a branch with result counts per commit, which is how you spot where a regression appeared.
  • list_builds, list_boots, list_tests: paginated lists with arch, tree, date range and status filters and a fields projection to keep responses small.
  • get_build, get_test: full details for a single build, boot or test, including logs.
  • list_issues, get_issue, get_issue_builds, get_issue_tests: KernelCI’s recognised failure patterns and everything they are matched against.

Act on the results (Maestro):

  • retry_job: re-run a failed or incomplete job.
  • trigger_checkout: start a custom pipeline run for a git URL, branch and commit, restricted to named jobs and platforms.
  • trigger_patchset: apply patches on top of an existing checkout and run the pipeline on the result.
  • get_node, list_nodes: poll the jobs you started, with field=value and regex filters.

State-changing tools are annotated as non-read-only. Whether they require confirmation depends on the MCP client and its approval settings.

Responses are deliberately sized for context-limited clients. get_summary returns compact aggregates unless detail=true is passed, list tools paginate with a default limit of 20, and fields let the model ask for only the keys it needs. This matters more than it sounds: a full test list for one mainline commit can run to tens of thousands of entries, and an assistant that pulls all of that into its context window will not be an assistant for long.

Workflows it is good at

The morning look

The most common triage question is “what is red today, and is any of it new?”. Answering it by hand means opening the dashboard, picking a tree, scanning the summary, clicking into the failures, and checking each one against the known issues list. With the MCP server the conversation looks like this:

You: What is the state of mainline master right now? Only tell me about failures that are not already known issues.

The assistant calls list_trees to find the latest mainline commit, then get_summary for it. Running that against a real checkout this week returned 63 passing builds and 3 failing, 189 boots all passing, and 33,047 passing tests against 4,781 failures. The summary also carried the three build failures already matched to known issues: an amdgpu stack frame size overflow, a -Wformat error in qla2xxx, and an inline assembly register exhaustion in nf_synproxy_core on i386. So the honest answer to the question is “all three reported build failures match known issues; no unmatched build failures were found in this checkout”, and the model can say so in one line, then move on to list_tests with status=fail to look at what is actually new in the test results.

Those numbers are not invented for the post; they were recorded for the referenced checkout on 26 August 2026, and current results may differ. Trimmed, the shape the model sees is:

Chasing a regression back to a commit

You: The arm64 boots on next/master started failing sometime this week. Which commit introduced it?

list_commits returns the branch history with build, boot and test counts per checkout, so the assistant can see the point at which the boot failure count stopped being zero, then call list_boots with arch=arm64 and status=fail on either side of it to confirm the platforms involved. From there it is a short step to kci-dev bisect on the range, and the assistant can hand you the exact command with the good and bad hashes filled in.

Is this failure mine, or everyone’s?

You: Is the atmel-mci build failure a stable-rc specific problem or does it show up elsewhere too?

list_issues returns this week’s recognised failure patterns, get_issue gives the details of one, and get_issue_builds lists every build it has matched, across every tree. Asking that question this week showed the atmel-mci “no member named bh_work” error appearing on four stable-rc branches (5.10, 5.15, 6.1 and 6.6) within the same hour on 20 August, and on no other tree, which is the signature of a backport rather than a new upstream bug. A multi-step manual check becomes a single question, and the assistant can lay out the affected branches in a table.

Hardware health

You: Which platforms have had boot failures on mainline in the last week?

list_hardware followed by get_hardware_summary for the candidates gives a per-platform picture. This is the question lab maintainers ask most, and it is the one the dashboard makes hardest to answer across many boards at once.

Retest, and test a fix

With a token configured, the same conversation can carry on into action:

You: That looks like a flaky boot on the rk3399 rock-pi-4. Retry it, and let me know when it finishes.

retry_job creates the new job; get_node polls it. And if you have a candidate fix:

You: Apply this patch on top of the latest mainline checkout and run only baseline-arm64 on the Raspberry Pi 4 and the rock-pi-4.

trigger_patchset does exactly that, returning a node id you can watch with list_nodes filtered by treeid. Because these tools are marked as actions, the client will show you the parameters and ask before it sends anything.

Patch testing is new in kci-dev and works the same way from the CLI. It is a two-step flow: kci-dev checkout creates a checkout of the tree, branch and commit your patches are based on and prints a checkout_nodeid; kci-dev patchset –nodeid <id> then applies patches on top of it and runs the pipeline on the result. Patches can be local files from git format-patch or URLs from an allowed domain such as patchwork.kernel.org, which means you can test a series straight from the list before it is applied anywhere:
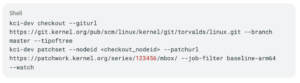
The MCP trigger_patchset tool takes the same nodeid, patches or patchurls, job_filter and platform_filter, so an assistant that has just found a failure can be asked to test the proposed fix without you leaving the conversation.

Reproduce it locally

You: The i386 allmodconfig build with clang failed. Give me what I need to reproduce it on my machine.

Where reproduction artifacts are available, the assistant can retrieve the build script, configuration, and metadata to help recreate the recorded build environment. get_build returns them in output_files: the exact build.sh the job ran, the final .config, the config fragments, a metadata.json with the architecture, compiler, defconfig and fragment list, and the source tarball URL. The assistant can fetch build.sh and hand you the environment (ARCH, CC, LLVM=1) and the make steps in order.

For the kbuild jobs that use the tuxmake backend, our kernel building tool, maintained by Linaro, it collapses further. tuxmake is the build tool used by KernelCI’s pipeline for its kselftest and several other configurations, and it is designed for portable, reproducible kernel builds inside containers. The build.sh for one of this week’s mainline arm64 builds contains this:
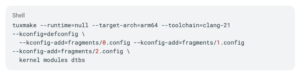
and the job also publishes a tuxmake_metadata.json with a reproducer_cmdline field and the exact toolchain version (clang 21.1.8, tuxmake 1.38.0 in this case). Newer builds go one better and publish a ready-made reproducer.sh that pins the toolchain container image and the build environment. Swap –runtime=null for –runtime=podman or –runtime=docker, point it at your checkout of the same commit, and tuxmake pulls the matching toolchain container and runs the identical build on your laptop. An assistant can do that translation for you, fragments and all.

Why this is a good fit for triage work

It would be easy to read the above as “the chatbot can click buttons for you”. The value is more specific than that: these are the tools that let an assistant make the joins the intro talked about, and a few more things besides.

It keeps the thread. A conversation remembers which tree, branch and commit you are looking at. You can drill from summary to failed builds to a single build’s log and back up again without re-entering anything, and the assistant can summarise a 2,000-line build log to the two lines that matter.

It can draft the report. The end product of triage is usually a message to a mailing list or a bug tracker: which trees, which platforms, which commit range, links to the evidence. The assistant already has all of that in its context by the time you ask, and it produces the write-up in the format you ask for.

It is the same data. The MCP server calls the same dashboard endpoints and the same Maestro API that the CLI and the web UI use, through Arisu’s KernelCIClient. There is no separate cache, no summarised copy, nothing that can drift out of date. If the assistant says a build failed, you can paste the build id into the dashboard and see the same thing.

It composes with what you already have. Because the server runs locally alongside your other tools, the assistant can combine KernelCI data with your git checkout, your mail client, or your issue tracker in one session. “Find the failing test, read the log, look at the diff of the suspect commit in my tree, and draft a reply to the author” is one prompt, not four tools.

Experimental, and asking for your help

The MCP server is marked experimental. Tool names, parameters and response shapes may change between releases as we learn how people actually use them, and we would rather hear about rough edges now than lock in a poor design. Please report anything surprising on the kci-dev issue tracker, and if you have a workflow the tools do not cover yet, say so; several of the filters and the fields projection exist because early users asked for them.

Where this is heading

Three directions are worth flagging, from already usable to still a proposal.

Closer to the lab. Most KernelCI boards run under LAVA, the lab automation framework maintained by Linaro, and Linaro also operates lab capacity feeding KernelCI. Today the MCP server already gets you part of the way in: a test or boot node carries the URL of its LAVA log, so an assistant can pull the raw job output and read the kernel panic, the failed test case, or the board that never answered its serial console. The natural next step is LAVA-aware tools in the server itself (job status, device health, resubmission), so that one conversation can go from a red cell on the dashboard, to the lab job that produced it, to the log line that explains it, without switching windows.

Reviews with test data in reach. Having the MCP available provides agent-driven code reviews and debug sessions with access to the test data from KernelCI, enabling them to do things like cross-reference reported issues with test results even with minimal prompting. With some work in projects like review-prompts we expect to improve the effectiveness of this integration.

Triage that starts on its own. Everything in this post is pull: a person with an assistant asks questions. An open RFC on kernelci-pipeline, #1565 by Yogesh Lal, explores the push side. It adds a TriageNotifier to the LAVA callback; when a job comes back failed or incomplete, the pipeline hands it to a separate triage-agent service that reads the LAVA log, runs a kernel triage skill through an LLM, and writes a Markdown root-cause report that can be filed as a GitHub issue or emailed. It is off by default and still under discussion, but it is the same idea seen from the other end: the MCP server gives a human an assistant, the triage-agent gives the pipeline one. If both land, the report waiting in your inbox and the conversation you have about it will be drawing on the same data.

Getting started

Install it, try it on your next triage, and join the conversation on the KernelCI Discord to share your experience with MCP workflows.

Acknowledgements

Thanks to Mark Brown (Arm), Denys Fedoryshchenko (Collabora), Yogesh Lal (Qualcomm), Anders Roxell (Linaro) and Arisu Tachibana (Cybertrust Japan Co., Ltd.) for their reviews and corrections to this article.

Bio

Ben Copeland chairs the KernelCI Technical Steering Committee and is a Senior Automation CI/CD Engineer at Linaro, where he leads the KernelCI team working to ensure the long-term stability of the Linux kernel.
Regzbot Joins KernelCI: Strengthening Linux Kernel Regression Tracking

By Blog

We’re excited to announce that regzbot, the Linux kernel regression tracking bot created by Thorsten Leemhuis, is joining the KernelCI project. This collaboration marks an important step forward in our shared mission to improve the quality, stability, and long-term maintenance of the Linux kernel.

About Regzbot

Regzbot is a regression tracking utility (dashboard, docs) that has become essential for the Linux kernel community. The bot allows developers and users to add regressions reports to the tracking using simple commands, such as #regzbot introduced: v6.1..v6.2-rc1. Regzbot notices those commands on various mailing lists as well as in bugzilla.kernel.org and a few other bug trackers used for kernel development. From then on regzbot watches out for replies to the tracked report as well as references to it on various mailing lists and in git trees. That way it monitors the issue’s progress on various fronts and can automatically mark tracked regression as resolved once a fix lands in the affected Linux series. By connecting and monitoring the various places relevant, regzbot acts as a kind of meta-bugtracking tool tailored for the special needs of the kernel – but is intentionally kept simple to not become yet another bug tracker.

As the Linux kernel’s regression tracker, Thorsten uses regzbot to keep an eye on regressions, which without the bot would not scale well. Regzbot thus allows Thorsten to ensure many regressions that otherwise might have been forgotten are resolved, as he prods reporters and developers when things stall according to regzbot – sometimes by involving Linus Torvalds, for example when developers do not handle regressions like the lead developer wants them to be dealt this is. Thorsten also uses regzbot to semi-automatically generate weekly reports for Linus Torvalds, which he then can use to decide whether to release a new kernel version or extend the development phase. 

Regzbot and Thorsten work with it has earned the community’s trust by automating what was previously exhausting manual work while maintaining a low-overhead approach. 

Why This Collaboration Matters

This partnership addresses critical needs for both projects. For KernelCI, regzbot provides the semi-automatic regression tracking we’ve needed—the ability to learn when a reported regression gets fixed and update our Dashboard accordingly. Regzbot’s strong reputation within the kernel community also creates a trustworthy path for KernelCI to report regressions to maintainers.

For the kernel community, this collaboration means regzbot will receive dedicated resources to expand its capabilities and improve its user experience, benefiting the entire kernel ecosystem.

What’s Next

Our roadmap focuses on three key areas:

Improved Architecture: We’re exploring redesigning regzbot’s scraper functionality as a standalone service that could benefit other kernel community use cases. We’ll be inviting kernel.org to participate in these discussions.

Extended scope: Regzbot will be redesigned to become more autonomous while also allowing subsystem maintainers to better stay on top of regressions in their domain with the bot’s help.

Modern User Experience: We will be creating a new interface for regzbot within the KernelCI Dashboard. This new UX will provide interactive features like filters, search, and grouping while maintaining the functionality the community relies on.

Better Integration: Once KernelCI regressions are tracked by regzbot, we’ll display relevant information directly in the Dashboard, including mail threads, bugzilla entries, git commit references, and regression status.

A Word from Thorsten Leemhuis

Regzbot was an experiment which turned out to be really successful: it has proven to be a useful tool to help ensure new Linux kernel versions work as well as their predecessors. This might sound benign, but it is not, as it is a crucial factor to make people willing to upgrade to new versions – and that is in everybody’s interest, as only those get all the security fixes and new hardening techniques to counteract current and future risks in this ever changing world. This aligns well with the goals of KernelCI, which is why it is a perfect new home for regzbot. The cooperation will furthermore empower regzbot and make it more capable, because as a team we’ll finally be able to polish and enhance regzbot to make it serve the Linux kernel users and developers a lot better than it does now.

Get Involved

We’re committed to transparent, community-driven development. Any changes will be made carefully, with thorough testing and feedback, to preserve the reliability that has made regzbot valuable.

If you’re interested in following this work:

We look forward to working with Thorsten and the entire kernel community to make regression tracking even more effective.

For more information, visit https://kernelci.org and https://linux-regtracking.leemhuis.info/about/.

KernelCI – 2025.Q4 updates

By Blog, Community

The KernelCI community had a great finish of the year. Since our last update here, we tackled some quite interesting features based on community feedback. See detailed updates in the sections below. 

New KernelCI TSC

KernelCI has announced its new Technical Steering Committee (TSC) composition following the annual election process. The committee, which guides the technical direction of the project and ensures cohesion across the Linux kernel testing ecosystem, now consists of seven members: Ben Copeland (Linaro) serving as TSC Chair, Denys Fedoryshchenko (Collabora) as Infrastructure Committee Lead, and community-elected members Greg KH (Linux Foundation), Gustavo Padovan (Collabora), Mark Brown (Arm), Minas Hambardzumyan (Texas Instruments), and Yogesh Lal (Qualcomm).

This diverse group brings together expertise from major hardware vendors, infrastructure specialists, and kernel maintainers, with the current term running until October 31, 2026. The TSC meets bi-weekly in open sessions to discuss technical decisions, roadmap planning, and ensure KernelCI continues to effectively support the Linux kernel community’s testing needs.

KernelCI meeting public calendar

As you may have noticed, the KernelCI community is growing. New TSC, new working groups, more community members with newcomers arriving frequently. To facilitate access we created a public calendar to announce all our meetings to the community. Through it, it is possible to register yourself to any KernelCI community meeting. Recordings are also available for those who want to watch the meeting at a later time.

Dashboard improvements

This quarter was very focused on the health of the project.

We have introduced monitoring over the API requests and system resources. On top of that, we had a significant increase of backend test coverage, from 40% to nearly 70%, including some benchmark tests. 

There is still plenty to be done, and we intend to continue refining the CI/CD of our project, further automating the delivery of future enhancements.

The main functional achievement we had was reaching the last milestone of KCIDB-ng, placing the ingestion of KCIDB submissions closer to the Django backend.

This allowed the team to detach the KCIDB schema from the dashboard database, which provides more freedom to normalize the data, making the API faster and reducing the storage footprint.

 We are still meeting every two weeks in the Kernel CI Working Group to explore ideas. One experiment we ran this quarter consisted of adding a few simple filters and columns about “Labs” in some of the tables. 

Pull-mode for labs

As part of the work in our Labs Working Group, the team has been working on the Maestro interface to allow labs to pull all the information they need about tests KernelCI can execute. That includes kernel builds, testing rootfs and anything else needed for organizations to run KernelCI tests on their own setup whatever lab technology they are using.

We believe that pull-mode will enable a multitude of labs that were not able to participate in KernelCI before. With pull-mode a lab can be behind a firewall, something quite common in many corporate environments. It is also lab technology agnostic as everything the lab has to do is to listen to Maestro API and then send results to our KCIDB API.

Linaro donating tuxmake, tuxrun, tuxlava

The following repositories are now live under the KernelCl GitHub namespace:

– https://github.com/kernelci/tuxmake

– https://github.com/kernelci/tuxrun

– https://github.com/kernelci/tuxlava 

KernelCI is the Linux kernel’s upstream testing and continuous integration ecosystem. The project has started to use Tuxmake and TuxRun to power its build and test pipelines. Moving these tools under the KernelCI namespace brings them into an active community that will help evolve them alongside the kernel itself.

Linaro engineers will continue as co-maintainers and active contributors. All three projects retain their MIT License, so existing users and contributors will see no disruption.

Blog post announcement: https://www.linaro.org/blog/linaro-transfers-kernel-building-and-testing-tools-to-the-kernelci-project/ 

Core Infrastructure

  • More reliable event delivery: Added an optional mode that lets clients reconnect and catch up on missed events instead of losing them.
  • Better event discovery: Expanded filtering options so users can find specific events more precisely.
  • Faster event queries: Added database optimizations that speed up common event lookups
  • Maintenance reliability: Fixed a cleanup issue so old data can be removed as intended
  • Platform/tooling updates: Upgraded the database version and refreshed development tooling to improve stability
  • Build/CI automation was expanded with a new production workflow and tweaks to container image build automation.
  • Tooling/container configs were refreshed to newer toolchains and base images, with many older variants removed and patches updated.
  • A large legacy build configuration catalog was removed, alongside updates to runtime and rootfs configuration data.
  • A new pull-based lab runtime was added, including callback parsing, log handling, and result mapping; runtime configuration was extended to support it.
  • LAVA handling was hardened for retry scenarios, missing logs, and infrastructure failure reporting.
  • Storage uploads gained retry logic for network and server-side failures.
  • Forecast reporting was upgraded to generate an HTML report in addition to console output.

kci-dev improvements

kci-dev continued evolving as a well-packaged CLI suite that Linux distributions and labs can ship, focused on helping engineers analyze KernelCI results and triage problems quickly from the terminal.

We had several improvements to the project in the past quarter:

  • Released kci-dev v0.1.10, adding Arch Linux packaging support and more workflow/polish fixes, including Debian package build workflow updates and multiple fixes in issues/validation reporting and build-node filtering. 
  • Released kci-dev v0.1.9, with additional triage and UX refinements on top of the previously reported Q3 feature set: moved the detect workflow under results issues, added a command to fetch new issues for a checkout, and restructured the issues command group for clearer usage.
  • Improved validation and reporting ergonomics: enabled list views for boots validation, added runtime fields to boot/test JSON output, and fixed boot-origin filtering and other result-selection edge cases.
  • Conference and community outreach (Tokyo, Dec 2025): presented “Getting Started With New KernelCI CLI Tools” at Open Source Summit Japan 2025, and at Linux Plumbers Conference 2025 ran the Kernel Testing & Dependability MC plus gave “KernelCI kci-dev: Closing the developer feedback loop”.

Final Thoughts

We will keep working on making KernelCI easier for the community to benefit from. From greater stability to an improved Web Dashboard and a more complete kci-dev CLI, there’s much more to enhance in KernelCI for everyone. Big thank you to the entire KernelCI community for making this progress possible!Talk to us at kernelci@lists.linux.dev , #kernelci IRC channel at Libera.chat or through our Discord server!


Contributed to this blog post Arisu Tachibana, Denys Fedoryshchenko, Gustavo Padovan, Minas Hambardzumyan and Tales Aparecida.

Announcing the new KernelCI Technical Steering Committee (TSC)

By Blog, Community

We are pleased to announce the composition of the new KernelCI Technical Steering Committee (TSC). The TSC plays a vital role in guiding the technical direction of the KernelCI project, ensuring its continued growth and effectiveness in supporting the Linux kernel community.

New TSC Composition

Following our annual election process and in accordance with our project charter, the TSC is now composed of the following members:

  • Ben Copeland, Linaro (TSC-voted member) – TSC Chair
  • Denys Fedoryshchenko, Collabora (Infrastructure Committee Lead – appointed position)
  • Greg KH, Linux Foundation (Community-elected)
  • Gustavo Padovan, Collabora (Community-elected)
  • Mark Brown, Arm (Community-elected)
  • Minas Hambardzumyan, Texas Instruments (TSC-voted member)
  • Yogesh Lal, Qualcomm (Community-elected)

The current term for community-elected and TSC-voted members runs until October 31, 2026. As specified in our charter, the Infrastructure Committee Lead position is appointed and follows different term rules.  Ben Copeland will serve as the TSC Chair.

About the TSC

The Technical Steering Committee is responsible for:

  • Making important technical decisions about the project’s direction
  • Discussing the general roadmap and design principles
  • Ensuring cohesion across the project
  • Participating in votes on critical matters
  • Contributing to the project through code, reviews, documentation, and community engagement

We maintain a policy that no more than two members from the same organization may serve on the TSC simultaneously, ensuring diverse representation across the community.

Looking Ahead

This diverse group brings together expertise from across the kernel testing ecosystem, representing major hardware vendors, infrastructure specialists, and kernel maintainers. Their combined experience will be invaluable as KernelCI continues to evolve its infrastructure and expand testing coverage.

The TSC meets bi-weekly to discuss current topics and make decisions. These meetings are an important part of how we coordinate the technical aspects of the project and ensure we’re meeting the needs of the Linux kernel community. The meetings are open and listed on our calendar.

We thank all TSC members for their service and commitment to improving kernel quality and stability through comprehensive testing.

Get Involved

If you’re interested in contributing to KernelCI or learning more about our work, visit:

To reach the TSC directly, you can contact kernelci-tsc@groups.io.

KernelCI Welcomes Arm and Qualcomm as Premier Members

By Blog, Community

KernelCI Welcomes Arm and Qualcomm as Premier Members

We are thrilled to announce that two industry leaders, Arm and Qualcomm, have joined KernelCI as Premier members. This marks a significant milestone in our mission to ensure the quality, stability, and long-term maintenance of the Linux kernel through comprehensive testing across the broadest possible range of hardware platforms.

Both companies bring extensive expertise and resources that will significantly strengthen KernelCI’s testing ecosystem. Arm’s deep understanding of processor architecture and their commitment to open-source development aligns perfectly with our goal of standardizing hardware testing across diverse platforms. Arm has been involved with the KernelCI community for many years already, so it is great to see they are taking a step up joining as Premier Members. Meanwhile, Qualcomm’s proven track record in mobile and emerging computing platforms, combined with their existing contributions as a test result submitter to our common results database, demonstrates their ongoing commitment to kernel quality and stability.

“Arm’s commitment to the Linux kernel community is rooted in the belief that open collaboration drives long-term innovation,” said Mark Hambleton, SVP Software at Arm. “Our role in KernelCI reflects the importance we place on scalable, transparent kernel validation across the broad ecosystem of Arm-based solutions, with the aim of improving software quality and accelerating upstream development from cloud to edge.”

“KernelCI is a cornerstone of upstream Linux kernel development, it enables open-source developers to easily validate and test on a large number of different platforms, including Qualcomm’s, ensuring consistency and quality across the entire ecosystem”, said Leendert van Doorn, Qualcomm SVP of Engineering. “It is a capability that is front and center for Qualcomm’s increasing reliance on upstream enablement.”

The addition of Arm and Qualcomm as Premier members comes at an exciting time for KernelCI. Our new infrastructure dramatically improved the possibilities of KernelCI and the ecosystem we are building around it. So KernelCI is well-positioned to leverage the expertise and resources these new Premier members bring. Their involvement will help us expand testing coverage, improve hardware validation processes, and ultimately deliver better Linux kernel quality to the entire open-source community. We look forward to collaborating with both organizations as we continue to grow KernelCI’s impact on upstream kernel development.

KernelCI – 2025.Q3 updates

By Blog, Community

The KernelCI community continues to make great progress on multiple fronts of the project. Since our last update here, we have had two in-person events, a few technical achievements and new working groups launched. See detailed updates in the sections below. 

Videos from Automated Testing Summit

KernelCI hosted the Automated Testing Summit(ATS) 2025 in Denver, CO, USA. It is co-located with the Open Source Summit North America. The event was great and we had many interesting discussions.

All the sessions were recorded and videos are available:

KernelCI Workshop in Amsterdam

In the last week of August, we hosted our first KernelCI workshop in a while. We had 12 participants in-person and a few who joined us online. The workshop was great to kick start some important discussions about the new KernelCI Architecture with the community. 

During the workshop, we discussed how to fulfill maintainers’ use case, dealing with KernelCI labs issues, improving data quality and regression identification, KCIDB transition, RISC-V support and more. Check our notes and full video recording.

Transition out of legacy KCIDB

We finally completed our transition out of the legacy KCIDB. This was a very important step for the new KernelCI architecture. KCIDB is our common database for results, so on one end it has an API to receive test results white on the other is it as PostgreSQL database. The submission API has been supplanted by KCIDB-ng, but with no changes to the results submission JSON schema. Submitters are still sending the same files, but to a different API endpoint. KCIDB-ng is a fast Rust-based API to receive and store the JSON results files.

We’re transforming the KCIDB project into a more versatile, cloud-agnostic solution that can be deployed on-premise when needed. This flexibility allowed us to migrate KCIDB to Azure seamlessly. Additionally, we’ve rewritten portions of KCIDB in Rust, which has resolved longstanding performance bottlenecks.

All the other responsibilities were handed over to our Dashboard, so it is responsible for processing and ingesting the data in the JSON files to our PostgreSQL database. The schema of the database remained the same as legacy 

Core Infrastructure

Our new infrastructure has enabled us to significantly reduce complexity by implementing proper DevOps practices. Throughout Q3, we improved our deployment systems.  In daily operations, this translates to production updates that require minimal supervision and minimal downtime – what previously took hours now takes less than one minute. We’ve also developed our own storage solution that gives us greater control over data costs by maintaining a “hot” cache on VMs while storing longer-term data in object storage with lifecycle policies and more economical storage classes.

There was also an effort to enhance monitoring and alerting systems to proactively prevent issues before they affect users. This includes implementing more granular metrics and establishing alerts for critical performance indicators.

These infrastructure improvements have collectively enabled us to scale more effectively, reduce operational costs, and enhance overall reliability. We remain committed to continuing our infrastructure investments to support our growing demands and ensure we can meet the needs of our expanding user base.

New Labs WG

As a great outcome from the KernelCI Workshop, we created the Labs Working Group(WG) to discuss challenges for connecting test labs to KernelCI.

The Labs WG is already a pretty busy space with over 10 people joining the calls in our bi-weekly sync. The current focus includes improving Maestro API for labs to pull test information from KernelCI, adding support for Labgrid and evaluating dashboards for lab metrics.

The team identified several key challenges that prevent labs from connecting to KernelCI. The primary obstacle is that many labs cannot expose their APIs to the public internet due to strict security policies. To address this limitation, we proposed a pull-mode architecture that reverses the traditional workflow – allowing labs to pull test jobs from KernelCI rather than having KernelCI push jobs directly to them. This approach enables labs to maintain their existing security policies while still actively participating in KernelCI testing. We’re currently developing the protocols and implementations necessary to support this pull-mode architecture.

Dashboard WG

Inspired by the Labs WG, we started the KernelCI Dashboard Working Group (first invite), gathering users and the development team from ProFUSION to talk about bugs and features prioritization.

In two meetings, with 8 attendees, we have defined an action plan to improve the performance of the website, which was affecting user experience, stopped the development of a feature that did not spark joy, and defined the next target for the team: Handling hardware data from labs. Which will require more discussions regarding how that data could be used by the users.

kci-dev improvements

kci-dev has evolved from a small command-line tool into a well-packaged suite of tools that Linux distributions can ship, aimed at analyzing KernelCI results and helping engineers triage problems quickly.

We had many improvements to the project in the past quarter:

  • Added Debian/RPM packaging and OBS workflows/services automation so labs can build and publish updates automatically, so every client gets the same, reproducible toolchain.
  • Added results compare command for commit-to-commit regression detection (with tables + JSON output as well).
  • Consolidated results issues group to list/show issues and fetch related builds/tests.
  • Improved tree-level views with tree-report. 
  • Added code coverage information through new maestro coverage flow (currently only for chromiumos trees) with per-day buckets, a graph view, and report-info helpers, making stability/coverage trends far clearer.
  • Improved validation tooling filters (arch filter; better build selection and considering build/job retry during validation). The validation commands allows us to compare if the tests Maestro is running are landing properly in KCIDB.
  • Added –history to results summary.
  • Fixed results hardware list and added more filters. 

Hardware Information Registry

One of the challenges discussed in various KernelCI forums has been the inconsistency of hardware platform names reported from different testing labs, making it challenging to find/sort/filter results. To address this, a new YAML-based schema has been proposed by Minas Hambardzumyan and is currently in review. The schema organizes information into lists of platforms, processors, and vendors — providing a path to standardization of the reported platform names and adding traceability to product/vendor web pages for more information.

Final Thoughts

We will keep working on making KernelCI easier for the community to benefit from. From greater stability to an improved Web Dashboard and a more complete kci-dev CLI, there’s much more to enhance in KernelCI for everyone. Big thank you to the entire KernelCI community for making this progress possible!Talk to us at kernelci@lists.linux.dev , #kernelci IRC channel at Libera.chat or through our Discord server!

Contributed to this blog post Arisu Tachibana, Denys Fedoryshchenko, Gustavo Padovan, Minas Hambardzumyan and Tales Aparecida.

June 2025 updates – Linaro and ELISA joined KernelCI!

By Blog, News

A lot has happened in KernelCI since our last blog update. The community continues to grow with Linaro and ELISA joining as members and more contributors and companies adding test results. The infra as a whole continues to evolve. And we are in the first stages of the development of the kernelci.yml test plan standard.

Linaro and ELISA joined us a members

Linaro is joining as a Premier member and ELISA as an Associate Member. We thank you both for their commitment to take part in the KernelCI community and join us in our mission to ensure the quality, stability and long-term maintenance of the Linux kernel.

“Linaro is excited to be rejoining the KernelCI project. KernelCI’s mission to provide Linux Kernel developers with testing at scale across a diverse set of platforms is key to ensuring the long term quality, reliability and security of the Linux kernel. Linaro looks forward to helping KernelCI to grow and become an even more valuable resource.” said Grant Likely, Linaro CTO.

“Linking the requirements to the tests will enable more efficiency in regression testing,” said Kate Stewart, Vice President of Dependable Embedded Systems at the Linux Foundation. “Being able to connect the traceability between code, requirements and tests will get us closer to improving the code coverage and quality of the Linux kernel images. The ELISA Project is focusing on kernel requirements and is looking forward to working with the KernelCI community to make the regression testing more effective over time.”

Automated Testing Summit coming up

KernelCI is hosting the Automated Testing Summit(ATS) 2025 in Denver, CO, USA. It is co-located with the Open Source Summit North America. The agenda is out and a presentation from KernelCI bringing you the latest project updates is on the schedule. 

There is still time to sign up and meet us there. It is a hybrid event, so both in-person and virtual attendees are welcome.

Qualcomm,  RISC-V International and Texas Instruments International submitting results

KernelCI gained data from 3 new submitters. Both Qualcomm, RISC-V International and Texas Instruments connected their test systems to KernelCI. If you look at our architecture, they are part of our CI ecosystem. They start off by listening to new build events from Maestro, then they download the binaries for the built kernel and artifacts from Maestro. With the kernel and artifacts, they can execute the testing on their environment – sometimes hidden behind a firewall. When tests are completed, they submit complete results to KCIDB, which then becomes accessible through our Dashboard and kci-dev. 

.kernelci.yml test plan

We are proposing to introduce a standardized .kernelci.yml file in upstream kernel repositories to help the KernelCI community automatically discover and configure testing for each kernel tree. Part of the goal is to also transfer the ownership of the test plan by maintaining such files close to them or inside their subsystem folder. 

This YAML file would specify branches to be tested, kernel configs to build, tests to execute, etc, enabling project maintainers to directly declare their KernelCI preferences. The main benefit is reducing manual effort and guesswork currently involved in onboarding new trees to KernelCI, ultimately making kernel testing more scalable, transparent, and easier to maintain for both KernelCI maintainers and kernel developers.

KCIDB-ng

With the amount of test results data received by KernelCI everyday growing, KCIDB started to show wear off signs. To address the limitations, including a previous implementation heavily dependent on specific Google Cloud technologies, we created kcidb-ng. The new project brings a system that is easy to deploy not only locally for development but also can be run on any cloud environment. It also simplified a lot the ingestion process. 

Essentially, we have an API that receives json files with the test result content and stores the files in the spool directory. This entrypoint was written in Rust for efficiency. Then, we have an ingester looping in the server taking the files and ingesting them into PostgreSQL.

Additionally, kcidb-ng comes with logspec integration out of the box. So now data from any origin can be parsed to generate insights about build and test failures to generate KCIDB issue objects. The issues objects are the bridge between seeing a test failures and being able to report it as a regression to the community.

Right now, we are working with all KCIDB origins to move them over to the new API.

Strengthening core infra

Behind the scenes, we’ve been working hard to optimize our infrastructure costs and performance. Our build times on Azure build cluster improved dramatically from 88 to 17 minutes after migrating to modern D8lds_v6 instances, while actually reducing costs. We also implemented a caching solution for linux-firmware that cut our data egress costs by over 95% – from a projected $69k annually down to manageable levels. These optimizations mean faster feedback for developers and more sustainable operations for the project. Additionally, we’ve begun migrating KCIDB components to more cost-effective cloud services, starting with kcidb-rest, which will help us maintain reliable service while keeping infrastructure costs under control.

Final thoughts

We will keep working on making KernelCI easier for the community to benefit from. From greater stability to an improved Web Dashboard and a more complete kci-dev CLI, there’s much more to enhance in KernelCI for everyone. Big thank you to the entire KernelCI community for making this progress possible!Talk to us at kernelci@lists.linux.dev , #kernelci IRC channel at Libera.chat or through our Discord server!

Exploring the KernelCI Dashboard

By Blog, News

The KernelCI project is a critical initiative in the Linux kernel development ecosystem, providing automated testing and continuous integration for kernel builds. In this blog post, we’ll explore the current features available in the KernelCI Dashboard at https://dashboard.kernelci.org.

KernelCI Dashboard Overview

The current KernelCI Dashboard provides a comprehensive view of kernel testing activities, organizing information into three primary sections: Trees, Hardware, and Issues. This structure allows developers to easily navigate between different aspects of kernel testing. In this web dashboard, it’s possible to see the results of CI systems from different maintainers, checking their status, details, history and issues, while gathering valuable insight to work on a better and more reliable kernel.

Trees

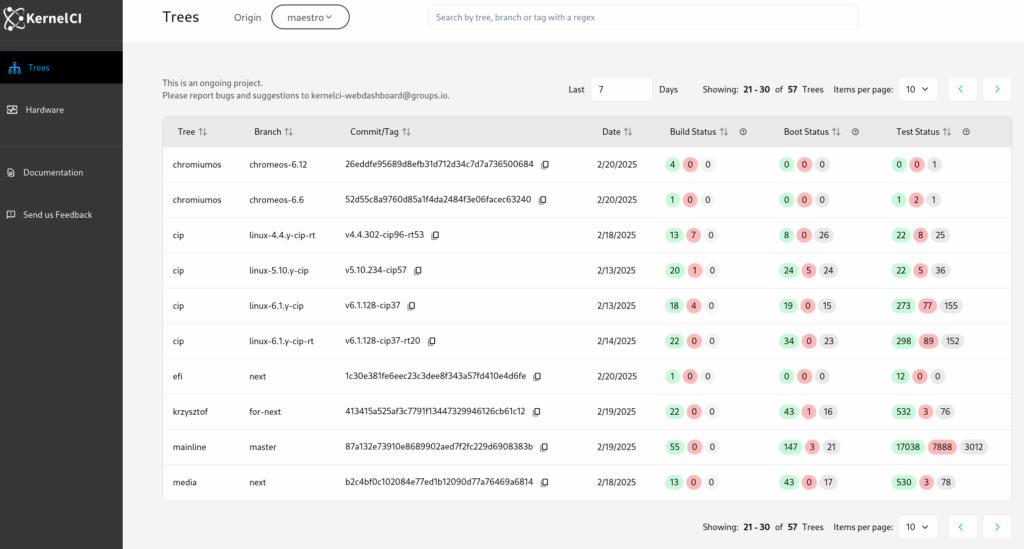
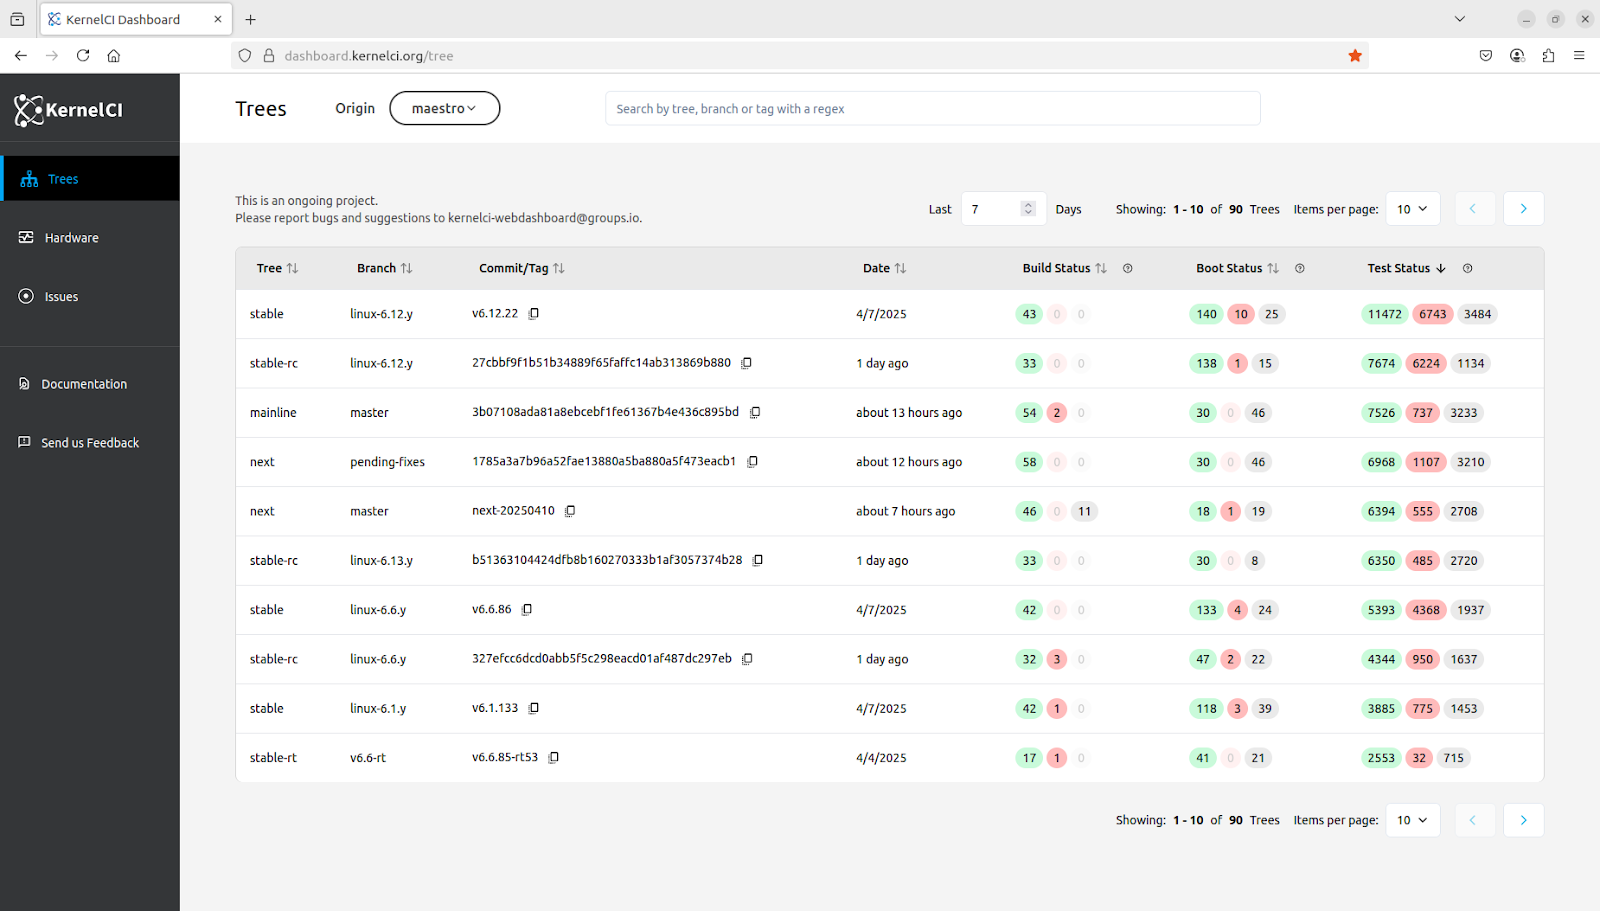
The Trees section serves as the main entry point to the dashboard, displaying a tabular view of kernel trees, branches, and commits being tested. The Dashboard visitor is then able to select the one they are interested in – a tree is a fork of the linux kernel with a specific branch and targeting a specific url.

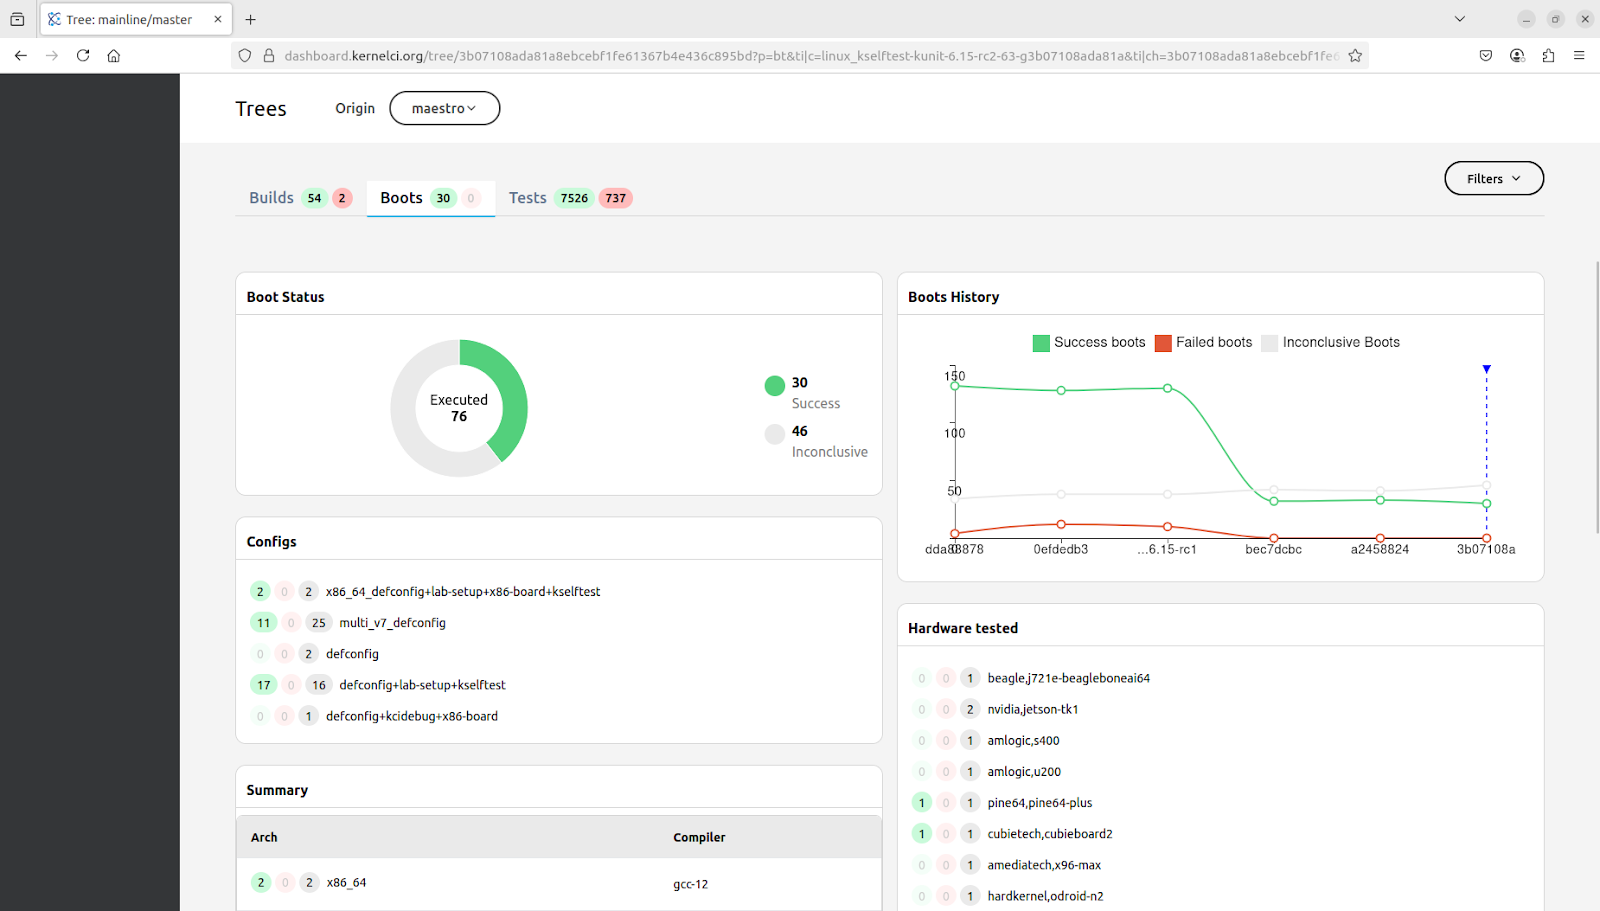
> Image: The Tree Listing page. It shows the website menu on the left, a header on top with a search bar and a table listing the 10 trees with the most number of tests, each row has the tree information as well as counts for how many builds, boots and tests were executed on it.

With options for sorting and searching for a specific tree, it is possible to check the details of a desired tree, where a user can see which configurations, architectures, hardware, and a history of the builds, boots and tests.

This allows maintainers to see the successes, failures and other results of the CI systems and are able to focus their attention on what matters the most to them. A preview of a build or test can be seen right on this page, reviewing tests or builds outputs, with highlights to failures and errors, and a list of issues that were triggered from it.

> Video: Navigating to the mainline Tree Details. There are cards with information about the specifications used, graphs for the result status and history of results, and a list of boot tests. A boot is selected and its output and issues are shown.

Builds and Tests

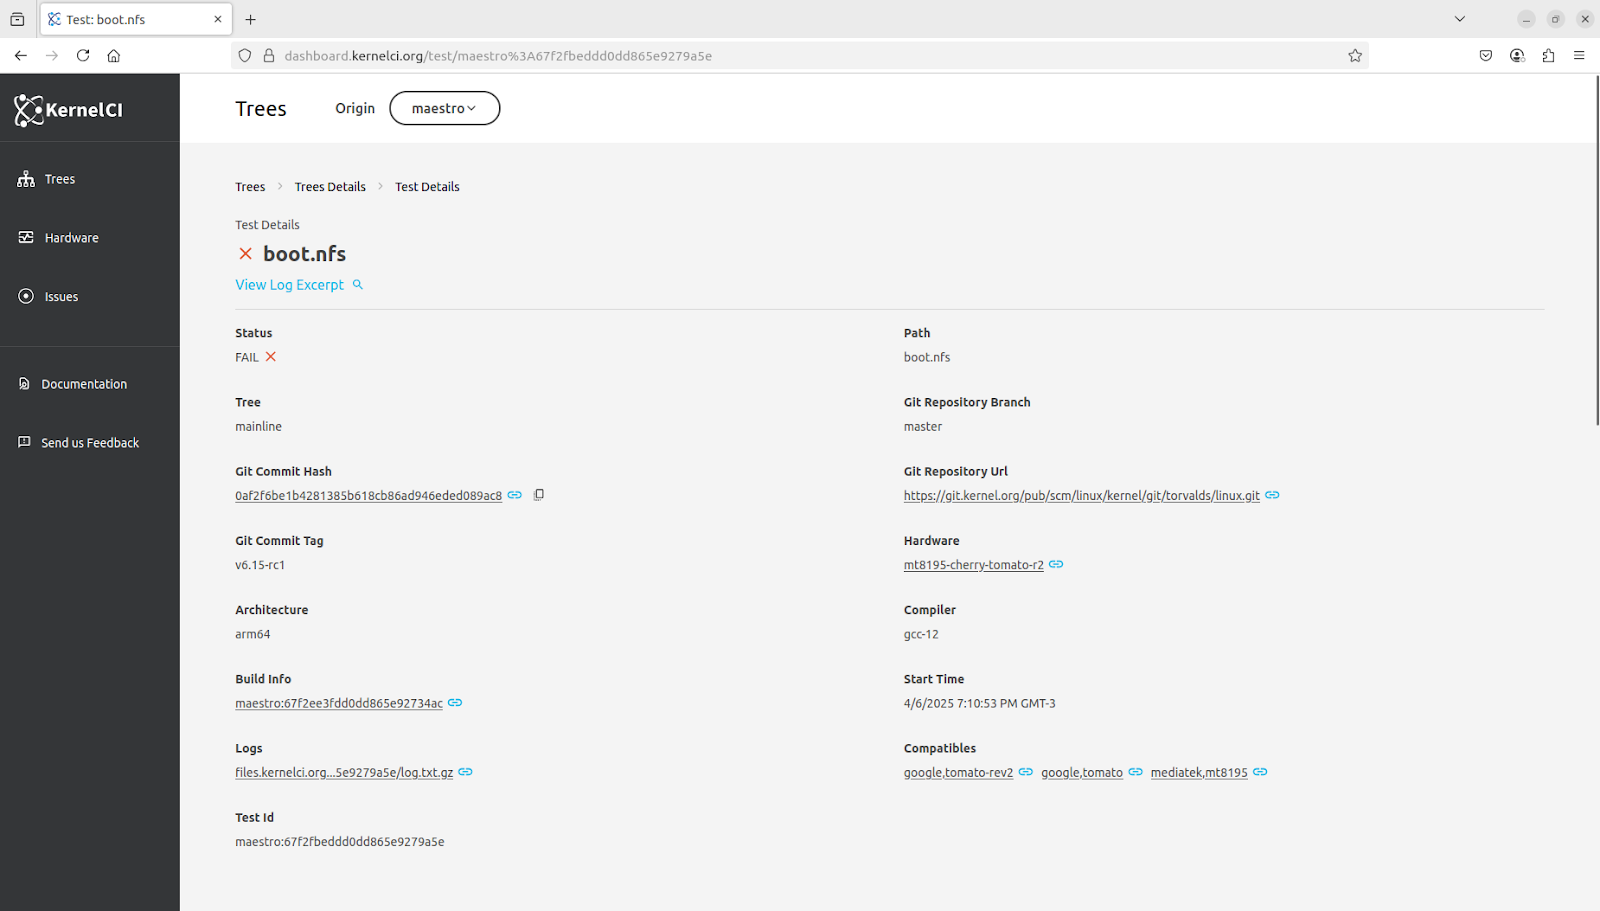
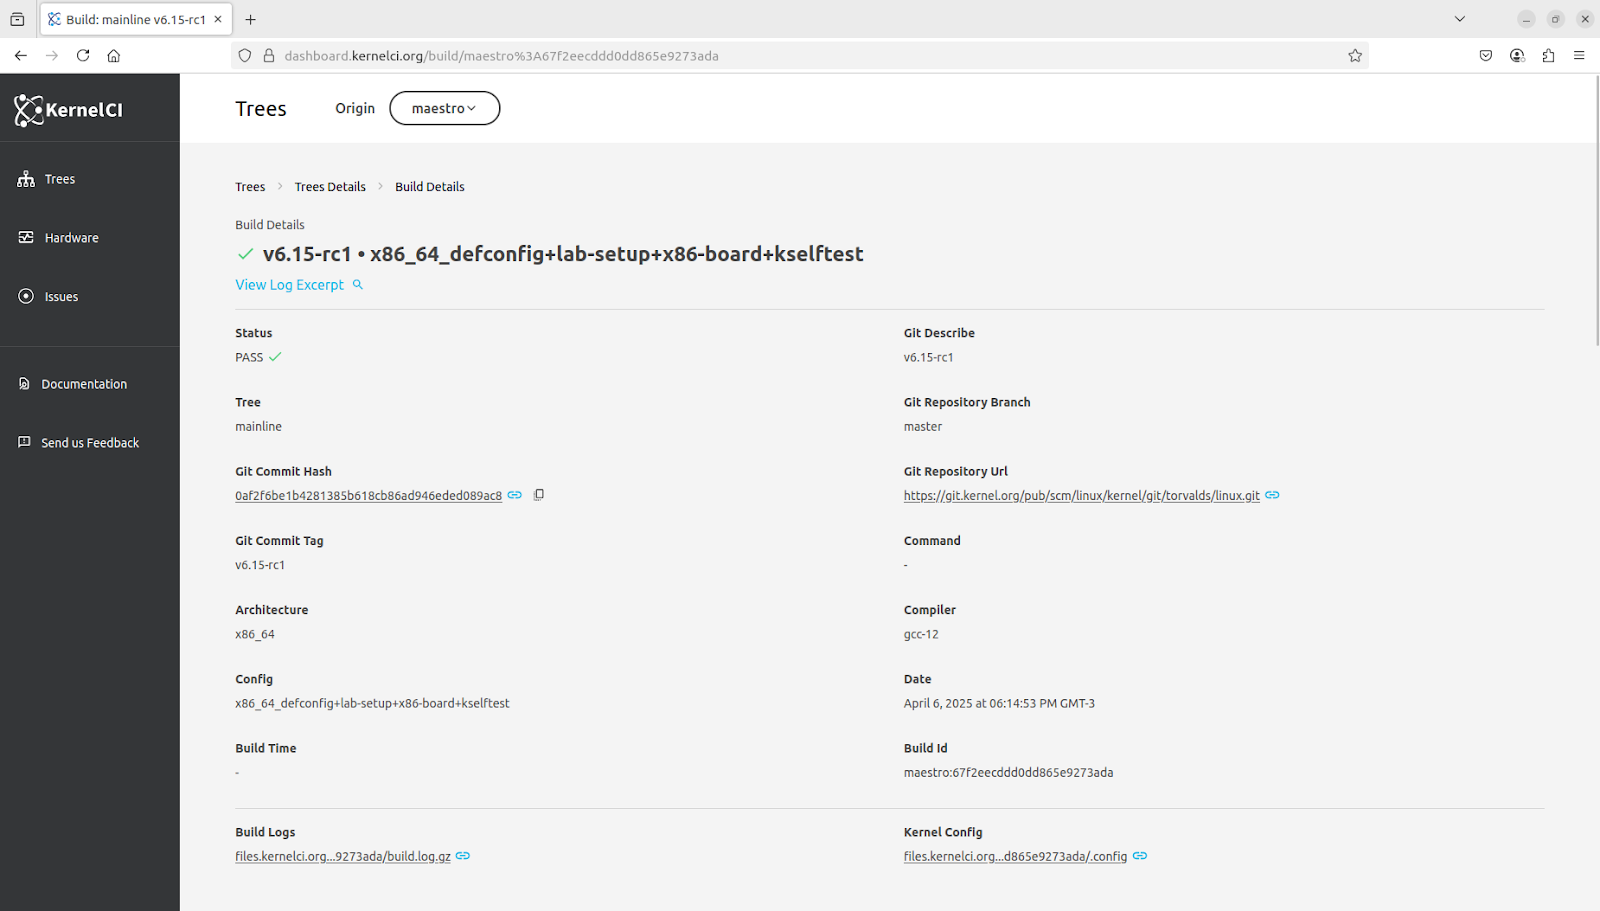
Each build and test also has a lot of data that a maintainer can find useful, so by pressing “View more details”, the user is directed to a page containing more information about that specific item, such as a the platform that was tested on, a history of a test result, the artifacts (logs or result files) that a test or build produced, and miscellaneous data. For a build, it is also possible to see every test that was executed on it, with links to the details of those tests.

> Video: A boot test details page. There are sections with basic information, as well as the history of its results, miscellaneous data from it, and the files it produced as artifacts.

> Video: A page with details of a build. There are sections with basic information, miscellaneous data, output files, and a table listing the tests that were performed on it.

Hardware

The Hardware section focuses on the physical devices used for testing, providing insights into how different kernels perform across various hardware platforms. Maintainers of such items might want to see the results of tests for that hardware independently of which tree it came from. For that purpose, the dashboard also contains a tab for listing the hardware that were tested on.

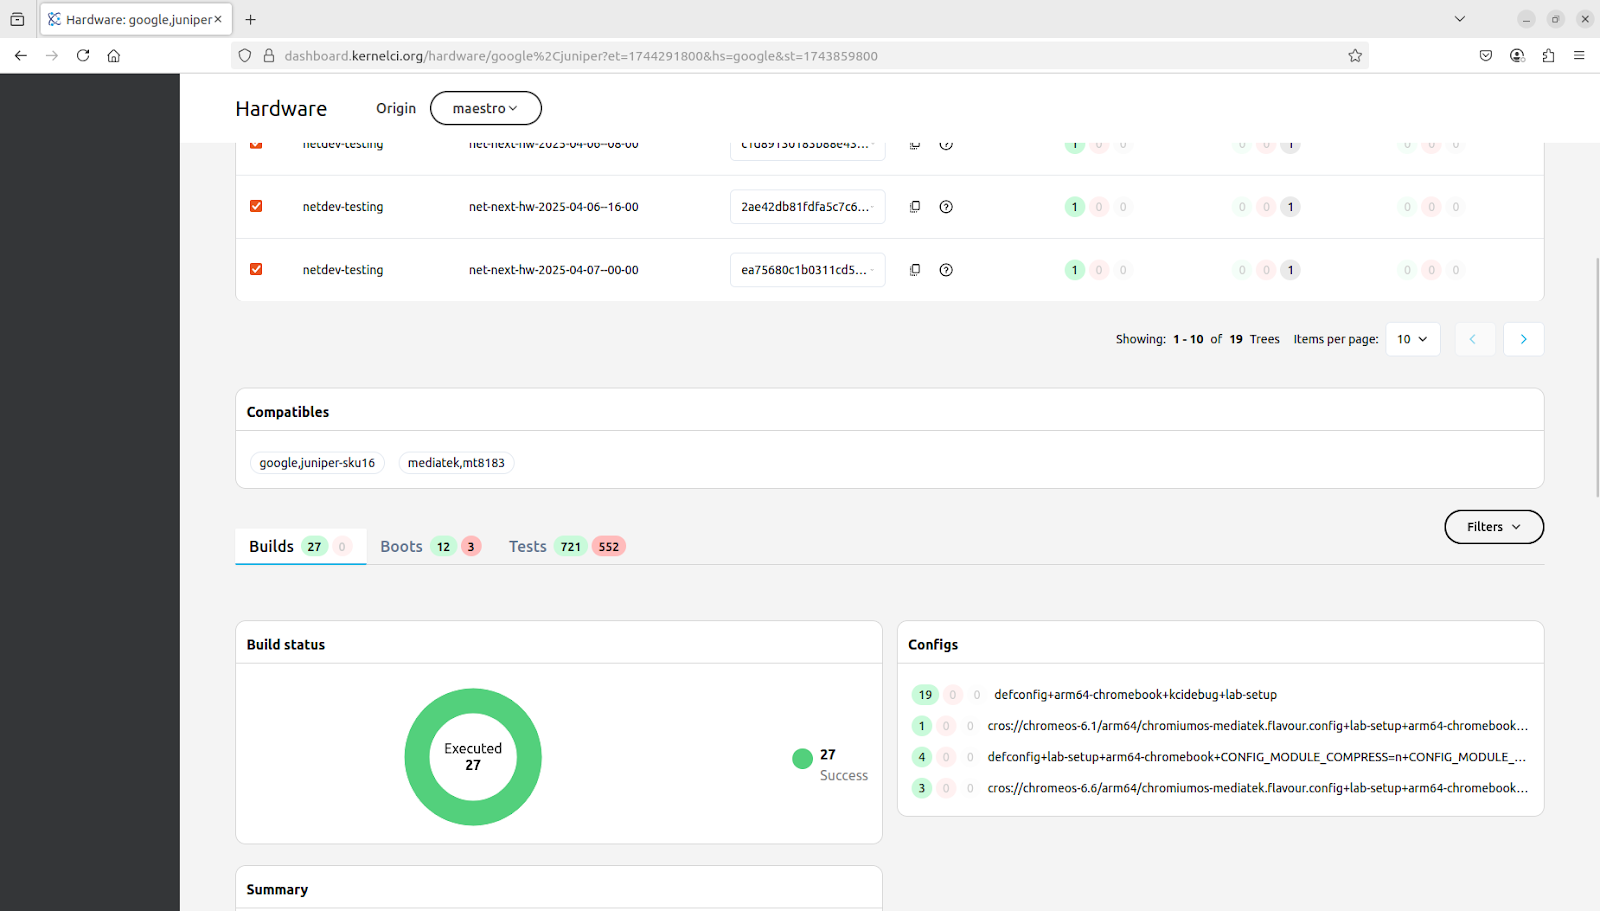
The listing is similar to that of trees, but when entering the details pages, it is possible to see all the trees that contributed to testing on that hardware, as well as disabling or enabling the visualization of the results from that tree.

> Video: Navigation from the hardware listing page to a hardware details page. The details page shows a table at the top listing the trees that tested or had builds on that hardware, with their corresponding commit and counting of total builds, boots and tests.

Not only for trees in a specific hardware or hardware on a specific tree, it is also possible to filter for any of the card items by clicking on them or using the Filters button, allowing for better visibility of items that a user may be interested in.

Issues

The Issues section is dedicated to tracking problems identified during testing, making it easier for developers to identify and address failures.

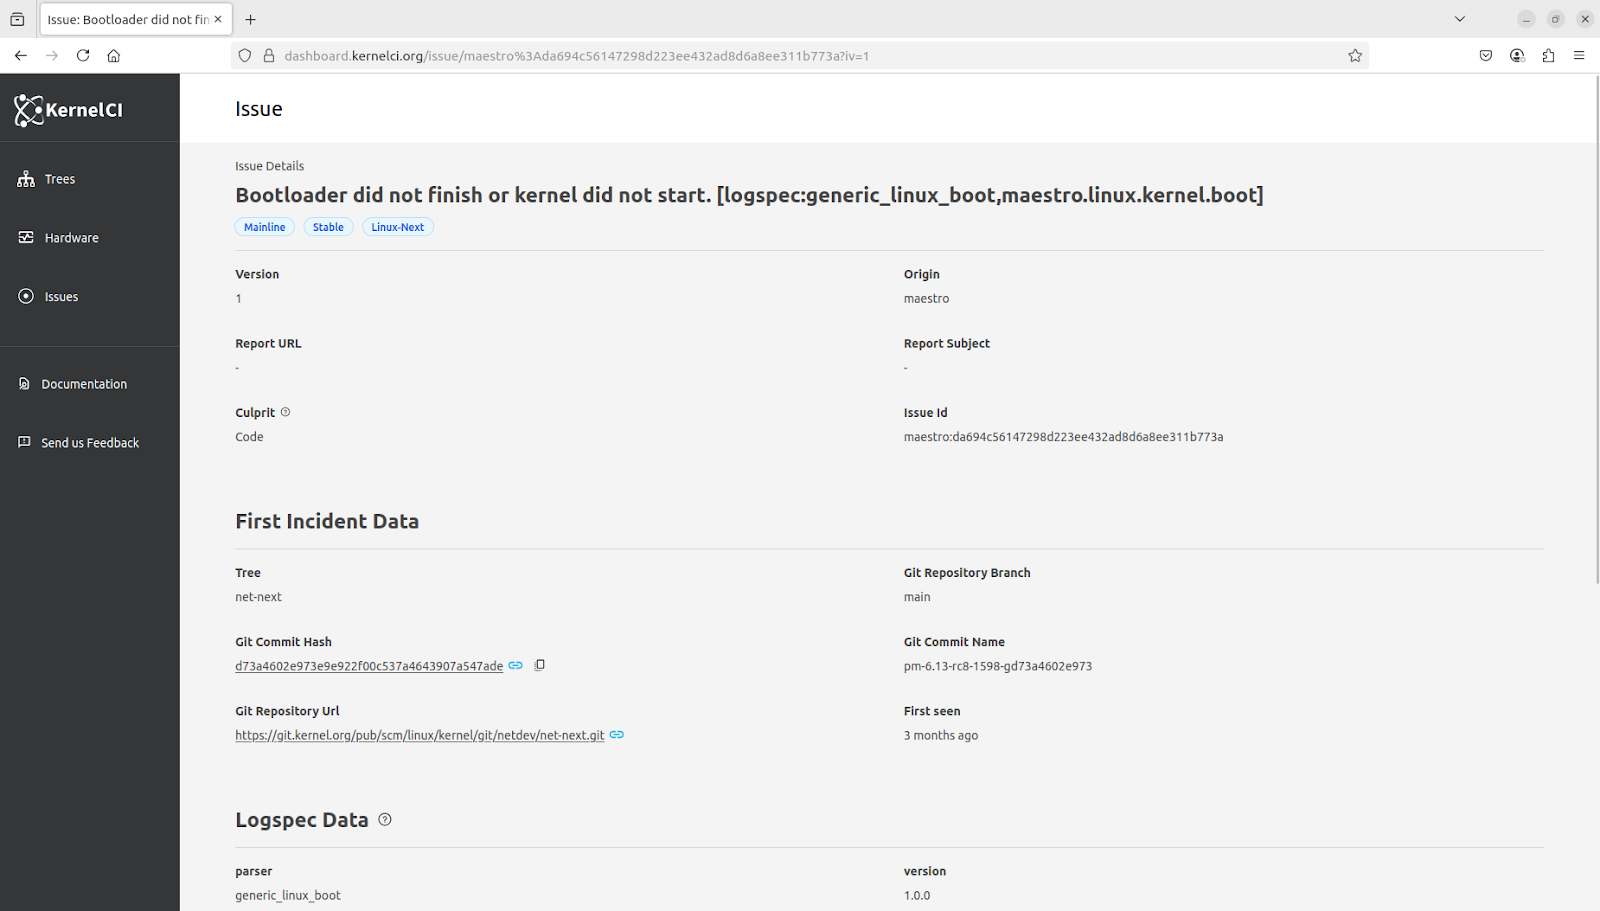
Issues group tests or builds when their results had a certain status or had a certain message in their logs or other conditions. In the dashboard, it is possible to list the most recent issues and when and where they have appeared, resembling the other listing pages.

From that page or from links throughout the dashboard, a user can navigate to a page with details of that issue, including the first time that issue caught a result, the specific data of how that issue came to be, and a list of every incident of that issue, builds or tests.

> Video: Navigating from the issue listing to an issue details page. The detailed page shows sections of the issue’s information, its first incident, the specifications of its error, miscellaneous data, and a table with builds that triggered that issue.

Closing thoughts

The current KernelCI Dashboard provides a powerful interface for monitoring, analyzing, and troubleshooting kernel testing results. Its comprehensive features make it an essential tool for kernel developers, distributions, and hardware vendors who rely on Linux kernel stability and compatibility.

The dashboard allows users to inspect CI results from trees, hardware, builds, and tests; checking for specific issues, filtering for certain configurations and looking over results of their interest. Coupled with detailed pages, interactions and CI results history, it provides better tools for specific use cases, enhanced visualization, and improved troubleshooting capabilities. With a redesigned interface and easy shareability and filtering, the Dashboard can address the needs of different users in the kernel development ecosystem, from maintainers to lab operators.

Whether you’re a kernel developer tracking your patches, a distribution maintainer ensuring stability, or a hardware vendor verifying compatibility, the KernelCI Dashboard (both current and future versions) offers the insights and tools needed to ensure Linux kernel quality across the ecosystem.

Users are encouraged to report bugs and suggestions to kernelci-webdashboard@groups.io to help improve this vital project.

We’d like to thank you ProFUSION for their contributions to this project as supplier of the KernelCI Project. This blog post was written by then.

KernelCI – February 2025 updates

By Blog, News

For those of you who were at Linux Plumbers Conference last September, you got a great amount of updates from the KernelCI project. However, September is long in the past now. So it is time for a new round of updates.

In summary, in the past few months, we successfully stabilized our new infrastructure, shut down our legacy system. Then, we also developed logspec for parsing test logs, made more progress on the new Web Dashboard, launched kci-dev for kernel developers, and began testing regression notifications via email. Let’s now dive into specific topics for a short update!

Web Dashboard development progress

While we believe the Web Dashboard still has a lot to evolve, it is already able to provide results information for many use cases. The development team, funded by the KernelCI project, is continuously improving the dashboard based on user feedback. We invite everyone to use our new dashboard and share any feedback they may have.

logspec – new log parsing skills

logspec  is a new log parser designed to recognize contextual nuances. It is able to match patterns around build failures, boot issues, NULL pointer dereference, Kernel Panic, Kernel Bug, UBSAN warnings etc. We have integrated it in Maestro so far. There, it sits on the Maestro->KCIDB bridge and creates new issues in KCIDB when it finds any of the  tracked patterns in the code. So, here are examples of a build issue and boot issue. logspec is a new project, but already helping the community find key information quite fast. We hope to evolve it over the next few years.

Announcing kci-dev cmdline

A few months ago, we started kci-dev, our command line tooling for kernel developers and maintainers. kci-dev is still beta but its core features are taking shape:

  • sending specific test requests to Maestro: today we support testing any commit on any tree/branch available in KernelCI’s Maestro.
  • running bisections: we have an experimental tooling that allows us to run bisections for some regressions we found.
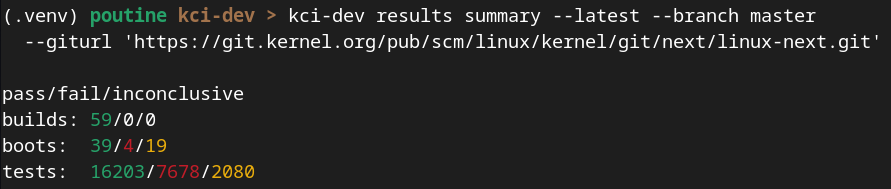
  • fetching test results from the dashboard: Today, we have basic support to fetch test results and download logs through the `kci-dev results`  command. 

Example run to fetch summary of results:

We invite developers to try it out and give us feedback on the functionalities they want to see in kci-dev.

Experimenting with results notifications

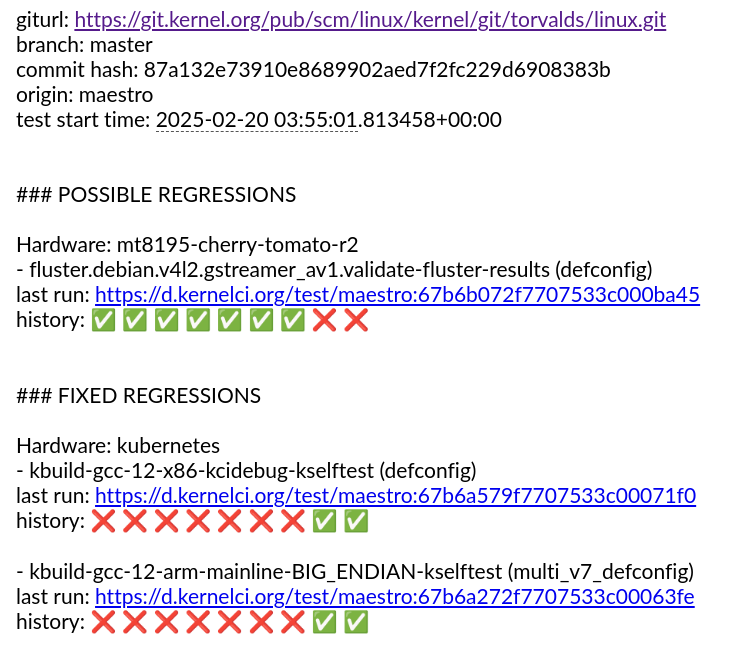
Over the past month, we’ve been developing  kernelci-notifications that are already capable of watching for new KCIDB issues and generating notifications for build and boot regressions filed in KCIDB. Currently, we are experimenting with issues created by Maestro, but the notification system is being designed for use with any CI system submitting data to KCIDB.  You can see examples of issues reported here. And excerpt follows as well:

KCIDB

KCIDB receives increasing amounts of kernel test data every day. As the project grows, so do its challenges. We are currently looking at improving the performance of KCIDB with long-term needs in mind. A few weeks ago, the KernelCI project published a RFQ for a specialist DBA support for KCIDB.

More hardware support

In the recent weeks, we have seen Penguntronix enable their lab in KernelCI’s Maestro, MediaTek Genio to add their newest hardware through the Collabora lab. As we speak, Qualcomm is working to enable more of their labs in KernelCI too.

New test Infra continues stabilization

We continue improving our core infra. Recently, we added automatic deployment of Maestro through GitHub actions and we also created kernelci-storage, a solution to help the KernelCI ecosystem to store test artifacts.

Final thoughts

We will keep working on making KernelCI easier for the community to benefit from. From greater stability to an improved Web Dashboard and a more complete kci-dev CLI, there’s much more to enhance in KernelCI for everyone. Big thank you to the entire KernelCI community for making this progress possible!
Talk to us at kernelci@lists.linux.dev, #kernelci IRC channel at Libera.chat or through our Discord server!

Bring your tree to the new KernelCI

By Blog

KernelCI is entering an exciting new phase, and we’re inviting kernel maintainers to register their trees with us.

We now support over 220 build configurations, run boot tests on 45 different hardware platforms (totaling over 300 machines in all labs), 7 CI systems contributing tests results and have test suites like kselftest, kunit and LTP already enabled, ensuring comprehensive coverage for your kernel trees across diverse platforms.

At the upcoming Linux Plumbers Conference, we’ll be unveiling our new Web Dashboard, which allows you to easily track your test results. Also, our team is ready to support you with custom Grafana dashboards tailored to your needs and optional email notifications. We can also enable your preferred test suites.

We’re committed to delivering real value and working closely with maintainers, developers, hardware vendors and product makers to provide specific solutions. Each subsystem and maintainer has unique needs, and we’re adapting our approach accordingly. We can build custom views and configure personalized notifications to help you focus on the results that matter most, minimizing unnecessary noise.

We encourage all maintainers to register their trees and take advantage of these new features. To get started, submit your request via our GitHub project or contact us directly at kernelci@lists.linux.dev .

During the Linux Plumbers Conference, we’ll have a hallway booth—please stop by to discuss your needs and share your feedback. KernelCI is committed to deliver solutions that matter to you.

Learn more about KernelCI in our documentation.